User guide
Here we share some tips and examples on how to use the DSL to tackle common use cases.
Provided examples use JUnit 5 and AssertJ, but you can use other test & assertion libraries.
Explore the DSL in your preferred IDE to discover all available features, and consider reviewing existing tests for additional examples.
The DSL currently supports most common used cases, keeping it simple and avoiding investing development effort in features that might not be needed. If you identify any particular scenario (or JMeter feature) that you need and is not currently supported, or easy to use, please let us know by creating an issue and we will try to implement it as soon as possible. Usually porting JMeter features is quite fast.
TIP
If you like this project, please give it a star ⭐ in GitHub! This helps the project be more visible, gain relevance, and encourages us to invest more effort in new features.
For an intro to JMeter concepts and components, you can check JMeter official documentation.
Setup
To use the DSL just include it in your project:
<dependency>
  <groupId>us.abstracta.jmeter</groupId>
  <artifactId>jmeter-java-dsl</artifactId>
  <version>2.2</version>
  <scope>test</scope>
</dependency>
testImplementation("us.abstracta.jmeter:jmeter-java-dsl:2.2") {
    exclude("org.apache.jmeter", "bom")
}
TIP
Here is a sample project in case you want to start one from scratch.
Simple HTTP test plan
To generate HTTP requests just use provided httpSampler.
The following example uses 2 threads (concurrent users) that send 10 HTTP GET requests each to http://my.service.
Additionally, it logs collected statistics (response times, status codes, etc.) to a file (for later analysis if needed) and checks that the response time 99 percentile is less than 5 seconds.
import static org.assertj.core.api.Assertions.assertThat;
import static us.abstracta.jmeter.javadsl.JmeterDsl.*;

import java.io.IOException;
import java.time.Duration;
import java.time.Instant;
import org.junit.jupiter.api.Test;
import us.abstracta.jmeter.javadsl.core.TestPlanStats;

public class PerformanceTest {

  @Test
  public void testPerformance() throws IOException {
    TestPlanStats stats = testPlan(
        threadGroup(2, 10,
            httpSampler("http://my.service")
        ),
        //this is just to log details of each request stats
        jtlWriter("target/jtls")
    ).run();
    assertThat(stats.overall().sampleTimePercentile99()).isLessThan(Duration.ofSeconds(5));
  }

}
TIP
When working with multiple samplers in a test plan, specify their names (eg: httpSampler("home", "http://my.service")) to easily check their respective statistics.
TIP
Set connection and response timeouts to avoid potential execution differences when running test plan in different machines. Here are more details.
TIP
Since JMeter uses log4j2, if you want to control the logging level or output, you can use something similar to this log4j2.xml.
TIP
Keep in mind that you can use Java programming to modularize and create abstractions which allow you to build complex test plans that are still easy to read, use and maintain. Here is an example of some complex abstraction built using Java features and the DSL.
Check HTTP performance testing for additional details while testing HTTP services.
DSL recorder
When creating test plans you can rely just on the IDE or you can use provided recorder.
Here is a small demo using it:
TIP
You can use jbang to easily execute the recorder with the latest version available. E.g.:
jbang us.abstracta.jmeter:jmeter-java-dsl-cli:2.2 recorder http://retailstore.test
TIP
Use java -jar jmdsl.jar help recorder to see the list of options to customize your recording.
TIP
In general use ---url-includes to ignore URLs that are not relevant to the performance test.
WARNING
Unlike the rest of JMeter DSL, which is compiled with Java 8, jmdsl.jar and us.abstracta.jmeter:jmeter-java-dsl-cli are compiled with Java 11 due to some dependencies requirement (latest Selenium drivers mainly).
So, to run above commands, you will need Java 11 or newer.
Correlations
To avoid fragile test plans with fixed values in request parameters, the DSL recorder, through the usage of the JMeter Correlation Recorder Plugin, allows you to define correlation rules.
Correlation rules define regular expressions, which allow the recorder to automatically add regexExtractor and replace occurrences of extracted values in following requests with proper variable references.
For example, for the same scenario previously shown, and using --config option (which makes correlation rules easier to maintain) with following file:
recorder:
  url: http://retailstore.test
  urlIncludes:
    - retailstore.test.*
  correlations:
    - variable: productId
      extractor: name="productId" value="([^"]+)"
      replacement: productId=(.*)
We get this test plan:
///usr/bin/env jbang "$0" "$@" ; exit $?
/*
These commented lines make the class executable if you have jbang installed by making the file
executable (eg: chmod +x ./PerformanceTest.java) and just executing it with ./PerformanceTest.java
*/
//DEPS org.assertj:assertj-core:3.23.1
//DEPS org.junit.jupiter:junit-jupiter-engine:5.9.1
//DEPS org.junit.platform:junit-platform-launcher:1.9.1
//DEPS us.abstracta.jmeter:jmeter-java-dsl:2.2

import static org.assertj.core.api.Assertions.assertThat;
import static us.abstracta.jmeter.javadsl.JmeterDsl.*;

import java.io.IOException;
import java.io.PrintWriter;
import java.nio.charset.StandardCharsets;
import org.apache.http.entity.ContentType;
import org.apache.jmeter.protocol.http.util.HTTPConstants;
import org.junit.jupiter.api.Test;
import org.junit.platform.engine.discovery.DiscoverySelectors;
import org.junit.platform.launcher.core.LauncherDiscoveryRequestBuilder;
import org.junit.platform.launcher.core.LauncherFactory;
import org.junit.platform.launcher.listeners.SummaryGeneratingListener;
import org.junit.platform.launcher.listeners.TestExecutionSummary;
import us.abstracta.jmeter.javadsl.core.TestPlanStats;

public class PerformanceTest {

  @Test
  public void test() throws IOException {
    TestPlanStats stats = testPlan(
        threadGroup(1, 1,
          httpDefaults()
            .encoding(StandardCharsets.UTF_8),
          httpSampler("/-1", "http://retailstore.test"),
          httpSampler("/home-3", "http://retailstore.test/home")
            .children(
              regexExtractor("productId#2", "name=\"productId\" value=\"([^\"]+)\"")
                .defaultValue("productId#2_NOT_FOUND")
            ),
          httpSampler("/cart-16", "http://retailstore.test/cart")
            .method(HTTPConstants.POST)
            .contentType(ContentType.APPLICATION_FORM_URLENCODED)
            .rawParam("productId", "${productId#2}"),
          httpSampler("/cart-17", "http://retailstore.test/cart")
        )
    ).run();
    assertThat(stats.overall().errorsCount()).isEqualTo(0);
  }

  /*
   This method is only included to make the test class self-executable. You can remove it when
   executing tests with maven, gradle, or some other tool.
   */
  public static void main(String[] args) {
    SummaryGeneratingListener summaryListener = new SummaryGeneratingListener();
    LauncherFactory.create()
        .execute(LauncherDiscoveryRequestBuilder.request()
                .selectors(DiscoverySelectors.selectClass(PerformanceTest.class))
                .build(),
            summaryListener);
    TestExecutionSummary summary = summaryListener.getSummary();
    summary.printFailuresTo(new PrintWriter(System.err));
    System.exit(summary.getTotalFailureCount() > 0 ? 1 : 0);
  }

}
In this test plan you can see an already added an extractor and the usage of extracted value in a subsequent request (as a variable reference).
TIP
To identify potential correlations, you can check in request parameters or URLs with fixed values and then, check the automatically created recording .jtl file (by default in target/recording folder) to identify proper regular expression for extraction.
We have ideas to ease this for the future, but, if you have ideas, or just want to give more priority to improving this, please create an issue in the repository to let us know.
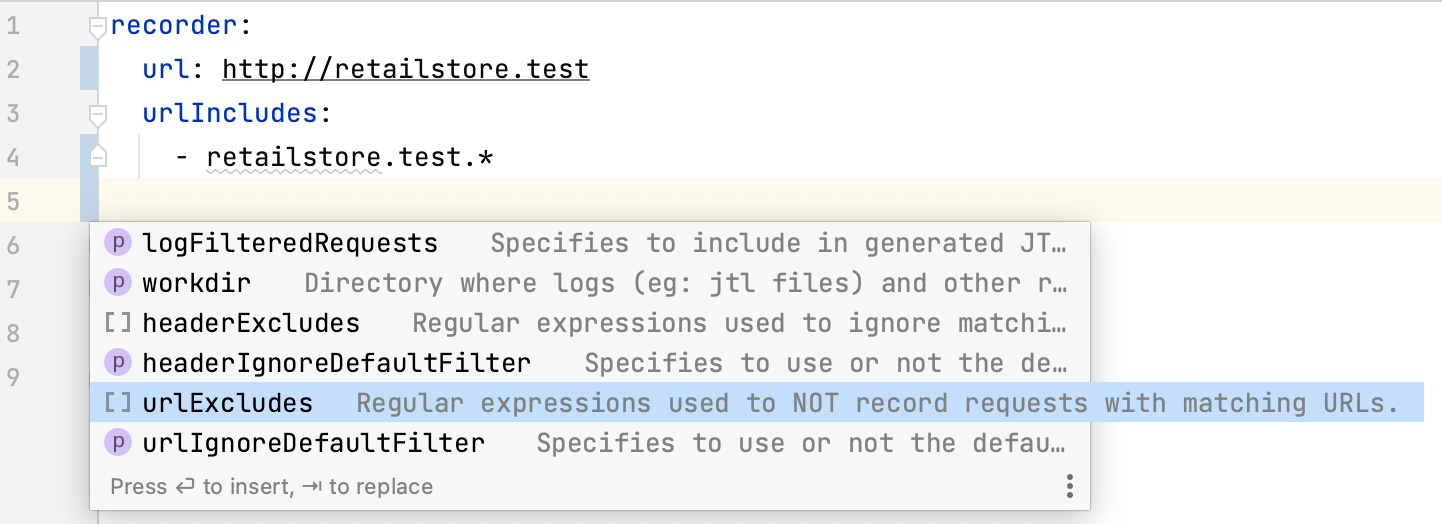
TIP
When using --config, take advantage of your IDEs auto-completion and inline documentation capabilities by using .jmdsl.yml suffix in config file names.
Here is a screenshot of autocompletion in action:
DSL code generation from JMX file
To ease migrating existing JMeter test plans and ease learning about DSL features, the DSL provides jmx2dsl cli command (download the latest cli version from releases page or use jbang) command line tool which you can use to generate DSL code from existing JMX files.
As an example:
java -jar jmdsl.jar jmx2dsl test-plan.jmx
jbang us.abstracta.jmeter:jmeter-java-dsl-cli:2.2 jmx2dsl test-plan.jmx
Could generate something like the following output:
///usr/bin/env jbang "$0" "$@" ; exit $?
/*
These commented lines make the class executable if you have jbang installed by making the file
executable (eg: chmod +x ./PerformanceTest.java) and just executing it with ./PerformanceTest.java
*/
//DEPS org.assertj:assertj-core:3.23.1
//DEPS org.junit.jupiter:junit-jupiter-engine:5.9.1
//DEPS org.junit.platform:junit-platform-launcher:1.9.1
//DEPS us.abstracta.jmeter:jmeter-java-dsl:2.2

import static org.assertj.core.api.Assertions.assertThat;
import static us.abstracta.jmeter.javadsl.JmeterDsl.*;

import java.io.IOException;
import java.io.PrintWriter;
import org.junit.jupiter.api.Test;
import org.junit.platform.engine.discovery.DiscoverySelectors;
import org.junit.platform.launcher.core.LauncherDiscoveryRequestBuilder;
import org.junit.platform.launcher.core.LauncherFactory;
import org.junit.platform.launcher.listeners.SummaryGeneratingListener;
import org.junit.platform.launcher.listeners.TestExecutionSummary;
import us.abstracta.jmeter.javadsl.core.TestPlanStats;

public class PerformanceTest {

  @Test
  public void test() throws IOException {
    TestPlanStats stats = testPlan(
        threadGroup(2, 10,
            httpSampler("http://my.service")
        ),
        jtlWriter("target/jtls")
    ).run();
    assertThat(stats.overall().errorsCount()).isEqualTo(0);
  }

  /*
   This method is only included to make the test class self-executable. You can remove it when
   executing tests with maven, gradle, or some other tool.
   */
  public static void main(String[] args) {
    SummaryGeneratingListener summaryListener = new SummaryGeneratingListener();
    LauncherFactory.create()
        .execute(LauncherDiscoveryRequestBuilder.request()
                .selectors(DiscoverySelectors.selectClass(PerformanceTest.class))
                .build(),
            summaryListener);
    TestExecutionSummary summary = summaryListener.getSummary();
    summary.printFailuresTo(new PrintWriter(System.err));
    System.exit(summary.getTotalFailureCount() > 0 ? 1 : 0);
  }

}
WARNING
Unlike the rest of JMeter DSL which is compiled with Java 8, jmdsl.jar and us.abstracta.jmeter:jmeter-java-dsl-cli are compiled with Java 11 due to some dependencies requirement (latest Selenium drivers mainly).
So, to run above commands, you will need Java 11 or newer.
TIP
Review and try generated code before executing it as is. I.e: tune thread groups and iterations to 1 to give it a try.
TIP
Always review generated DSL code. You should add proper assertions to it, might want to clean it up, add to your maven or gradle project dependencies listed on initial comments of generated code, modularize it better, check that conversion is accurate according to DSL, or even propose improvements for it in the GitHub repository.
TIP
Conversions can always be improved, and since there are many combinations and particular use cases, different semantics, etc, getting a perfect conversion for every scenario can get tricky.
If you find any potential improvement to code generation, please help us by creating an issue or discussion in GitHub repository.
Run test at scale
Running a load test from one machine is not always enough, since you are limited to the machine's hardware capabilities. Sometimes, is necessary to run the test using a cluster of machines to be able to generate enough load for the system under test.
BlazeMeter
By including the following module as a dependency:
<dependency>
  <groupId>us.abstracta.jmeter</groupId>
  <artifactId>jmeter-java-dsl-blazemeter</artifactId>
  <version>2.2</version>
  <scope>test</scope>
</dependency>
testImplementation 'us.abstracta.jmeter:jmeter-java-dsl-blazemeter:2.2'
You can easily run a JMeter test plan at scale in BlazeMeter like this:
import static org.assertj.core.api.Assertions.assertThat;
import static us.abstracta.jmeter.javadsl.JmeterDsl.*;

import java.time.Duration;
import org.junit.jupiter.api.Test;
import us.abstracta.jmeter.javadsl.blazemeter.BlazeMeterEngine;
import us.abstracta.jmeter.javadsl.core.TestPlanStats;

public class PerformanceTest {

  @Test
  public void testPerformance() throws Exception {
    TestPlanStats stats = testPlan(
        // number of threads and iterations are in the end overwritten by BlazeMeter engine settings
        threadGroup(2, 10,
            httpSampler("http://my.service")
        )
    ).runIn(new BlazeMeterEngine(System.getenv("BZ_TOKEN"))
        .testName("DSL test")
        .totalUsers(500)
        .holdFor(Duration.ofMinutes(10))
        .threadsPerEngine(100)
        .testTimeout(Duration.ofMinutes(20)));
    assertThat(stats.overall().sampleTimePercentile99()).isLessThan(Duration.ofSeconds(5));
  }

}
This test is using
BZ_TOKEN, a custom environment variable with<KEY_ID>:<KEY_SECRET>format, to get the BlazeMeter API authentication credentials.
Note that is as simple as generating a BlazeMeter authentication token and adding .runIn(new BlazeMeterEngine(...)) to any existing jmeter-java-dsl test to get it running at scale in BlazeMeter.
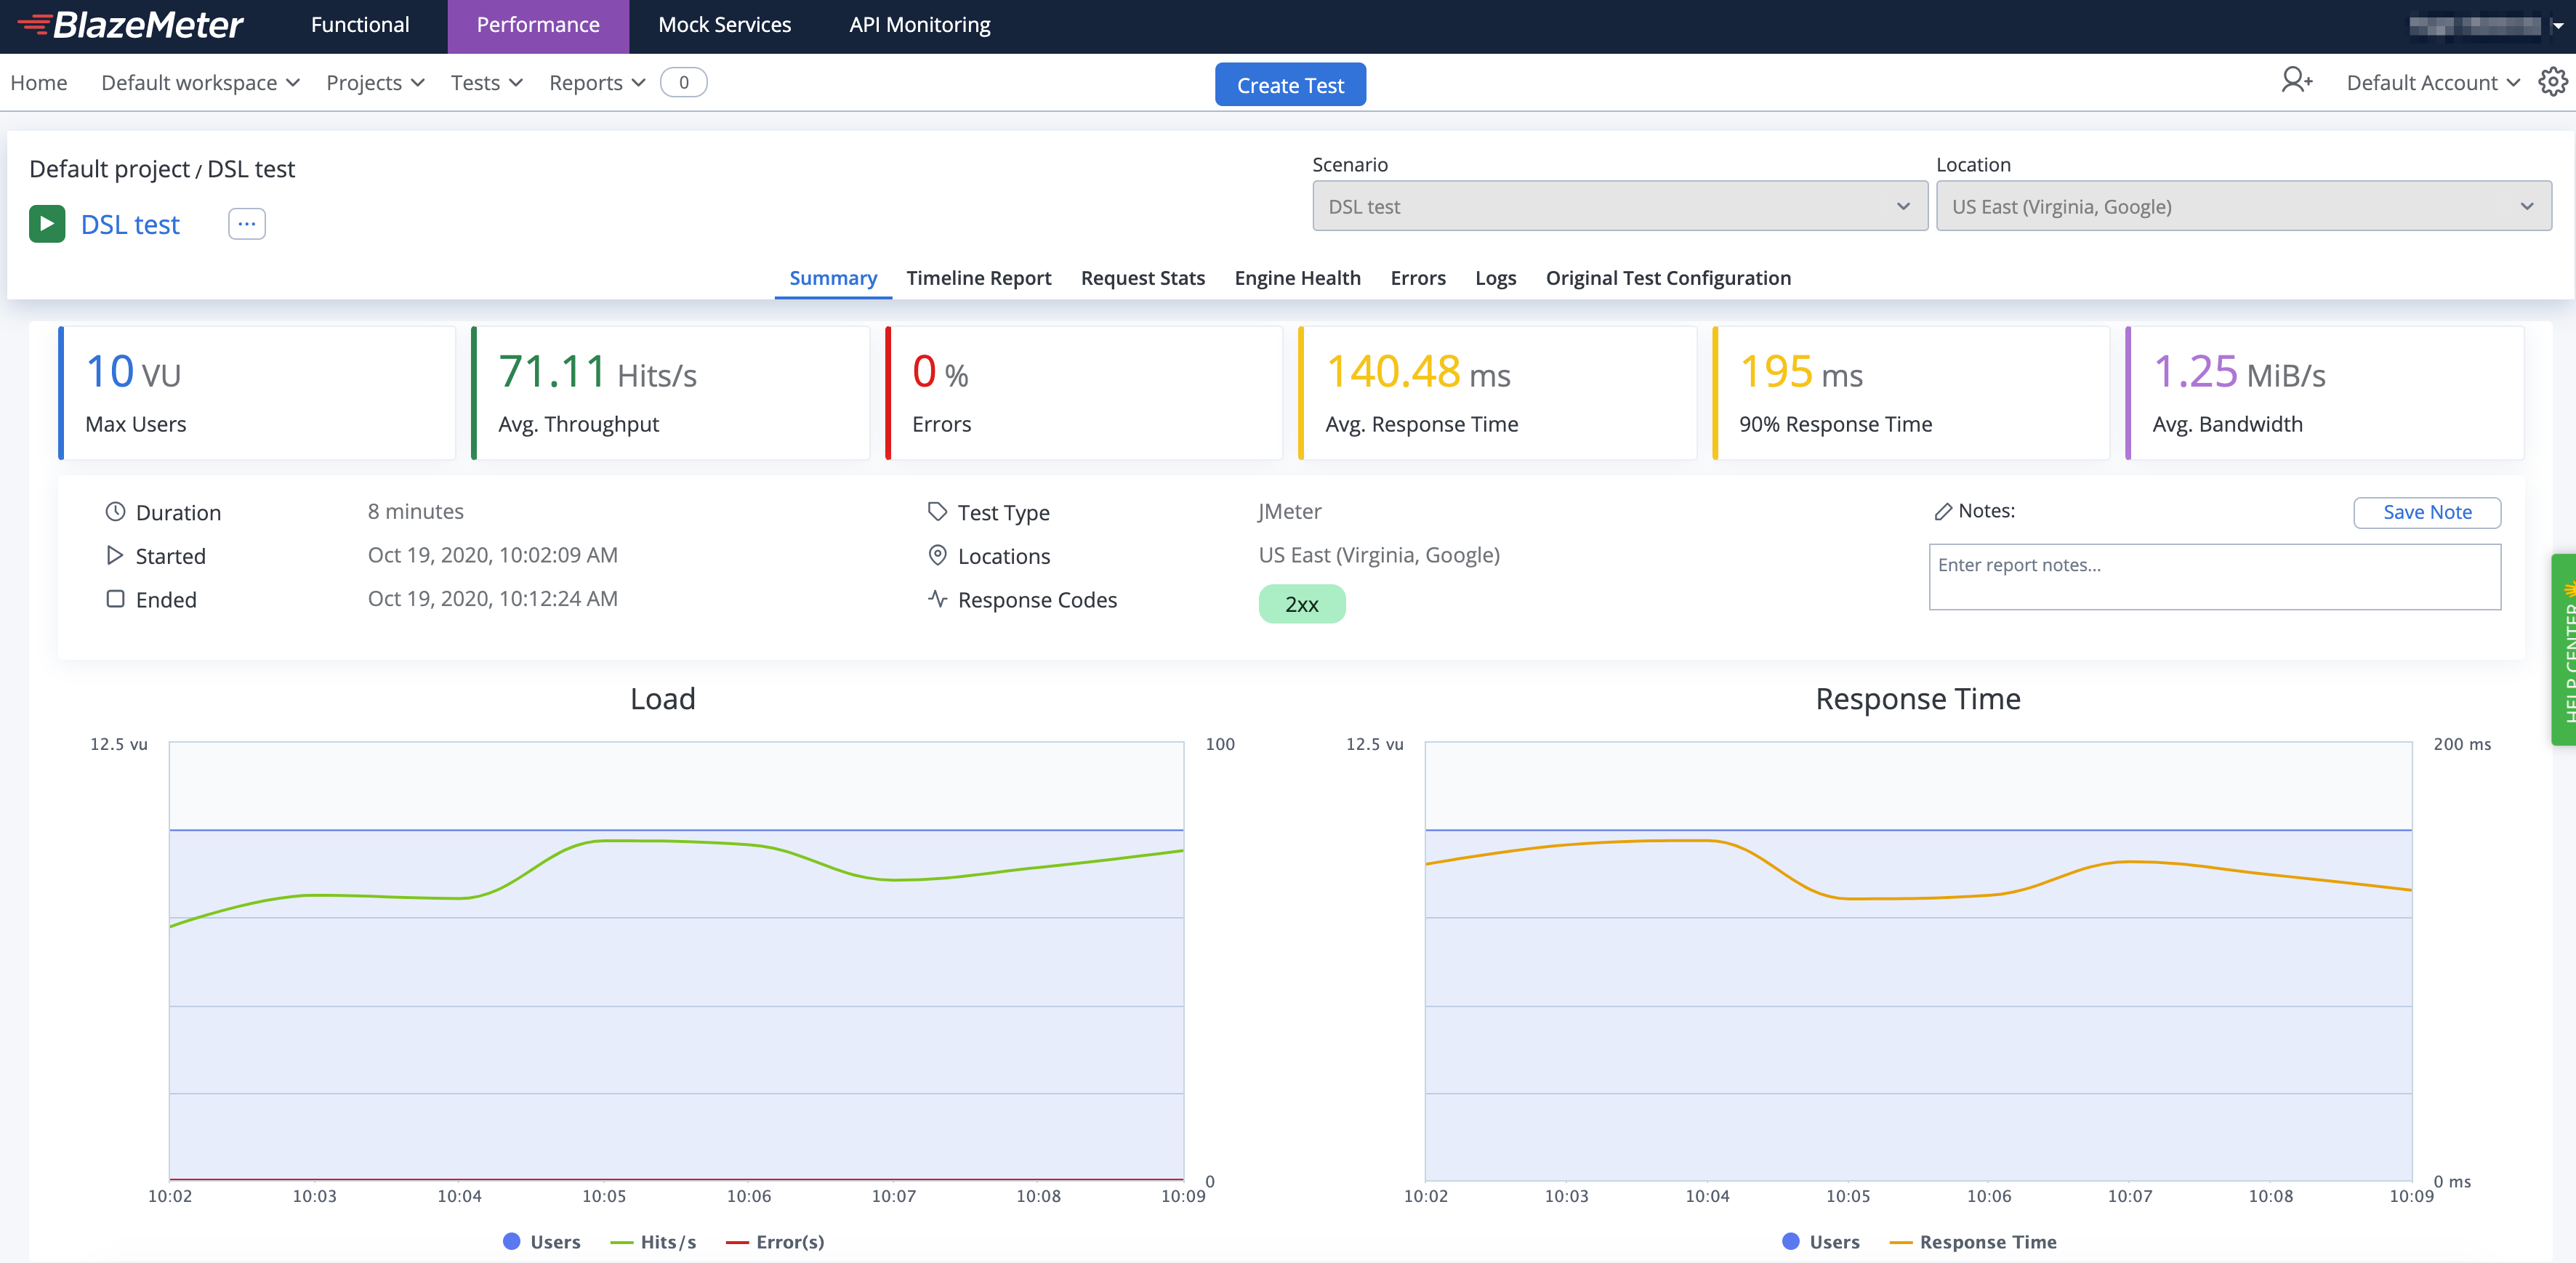
BlazeMeter will not only allow you to run the test at scale but also provides additional features like nice real-time reporting, historic data tracking, etc. Here is an example of how a test would look in BlazeMeter:
Check BlazeMeterEngine for details on usage and available settings when running tests in BlazeMeter.
WARNING
By default the engine is configured to timeout if test execution takes more than 1 hour. This timeout exists to avoid any potential problem with BlazeMeter execution not detected by the client, and avoid keeping the test indefinitely running until is interrupted by a user, which may incur in unnecessary expenses in BlazeMeter and is specially annoying when running tests in automated fashion, for example in CI/CD. It is strongly advised to set this timeout properly in each run, according to the expected test execution time plus some additional margin (to consider for additional delays in BlazeMeter test setup and teardown) to avoid unexpected test plan execution failure (due to timeout) or unnecessary waits when there is some unexpected issue with BlazeMeter execution.
WARNING
BlazeMeterEngine always returns 0 as sentBytes statistics since there is no efficient way to get it from BlazMeter.
TIP
BlazeMeterEngine will automatically upload to BlazeMeter files used in csvDataSet and httpSampler with bodyFile or bodyFilePart methods.
For example this test plan works out of the box (no need for uploading referenced files or adapt test plan):
testPlan(
    threadGroup(100, Duration.ofMinutes(5),
      csvDataSet(new TestResource("users.csv")),
      httpSampler(SAMPLE_LABEL, "https://myservice/users/${USER}")
    )
).runIn(new BlazeMeterEngine(System.getenv("BZ_TOKEN"))
    .testTimeout(Duration.ofMinutes(10)));
If you need additional files to be uploaded to BlazeMeter, you can easily specify them with the BlazemeterEngine.assets() method.
TIP
By default BlazeMeterEngine will run tests from default location (most of the times us-east4-a). But in some scenarios you might want to change the location, or even run the test from multiple locations.
Here is an example how you can easily set this up:
testPlan(
    threadGroup(300, Duration.ofMinutes(5), // 300 total users for 5 minutes
      httpSampler(SAMPLE_LABEL, "https://myservice")
    )
).runIn(new BlazeMeterEngine(System.getenv("BZ_TOKEN"))
    .location(BlazeMeterLocation.GCP_SAO_PAULO, 30) // 30% = 90 users will run in Google Cloud Platform at Sao Paulo
    .location("MyPrivateLocation", 70) // 70% = 210 users will run in MyPrivateLocation named private location
    .testTimeout(Duration.ofMinutes(10)));
TIP
In case you want to get debug logs for HTTP calls to BlazeMeter API, you can include the following setting to an existing log4j2.xml configuration file:
<Logger name="us.abstracta.jmeter.javadsl.blazemeter.BlazeMeterClient" level="DEBUG"/>
<Logger name="okhttp3" level="DEBUG"/>
WARNING
If you use test elements (JSR223 elements, httpSamplers, ifController or whileController) with Java lambdas instead of strings, check this section of the user guide to use them while running test plan in BlazeMeter.
OctoPerf
In the same fashion as with BlazeMeter, just by including the following module as a dependency:
<dependency>
  <groupId>us.abstracta.jmeter</groupId>
  <artifactId>jmeter-java-dsl-octoperf</artifactId>
  <version>2.2</version>
  <scope>test</scope>
</dependency>
testImplementation 'us.abstracta.jmeter:jmeter-java-dsl-octoperf:2.2'
You can easily run a JMeter test plan at scale in OctoPerf like this:
import static org.assertj.core.api.Assertions.assertThat;
import static us.abstracta.jmeter.javadsl.JmeterDsl.*;

import java.time.Duration;
import org.junit.jupiter.api.Test;
import us.abstracta.jmeter.javadsl.octoperf.OctoPerfEngine;
import us.abstracta.jmeter.javadsl.core.TestPlanStats;

public class PerformanceTest {

  @Test
  public void testPerformance() throws Exception {
    TestPlanStats stats = testPlan(
        // number of threads and iterations are in the end overwritten by OctoPerf engine settings
        threadGroup(2, 10,
            httpSampler("http://my.service")
        )
    ).runIn(new OctoPerfEngine(System.getenv("OCTOPERF_API_KEY"))
        .projectName("DSL test")
        .totalUsers(500)
        .rampUpFor(Duration.ofMinutes(1))
        .holdFor(Duration.ofMinutes(10))
        .testTimeout(Duration.ofMinutes(20)));
    assertThat(stats.overall().sampleTimePercentile99()).isLessThan(Duration.ofSeconds(5));
  }

}
This test is using
OCTOPERF_API_KEY, a custom environment variable containing an OctoPerf API key.
Note that, as with the BlazeMeter case, it is as simple as getting the OctoPerf API key and adding .runIn(new OctoPerfEngine(...)) to any existing jmeter-java-dsl test to get it running at scale in OctoPerf.
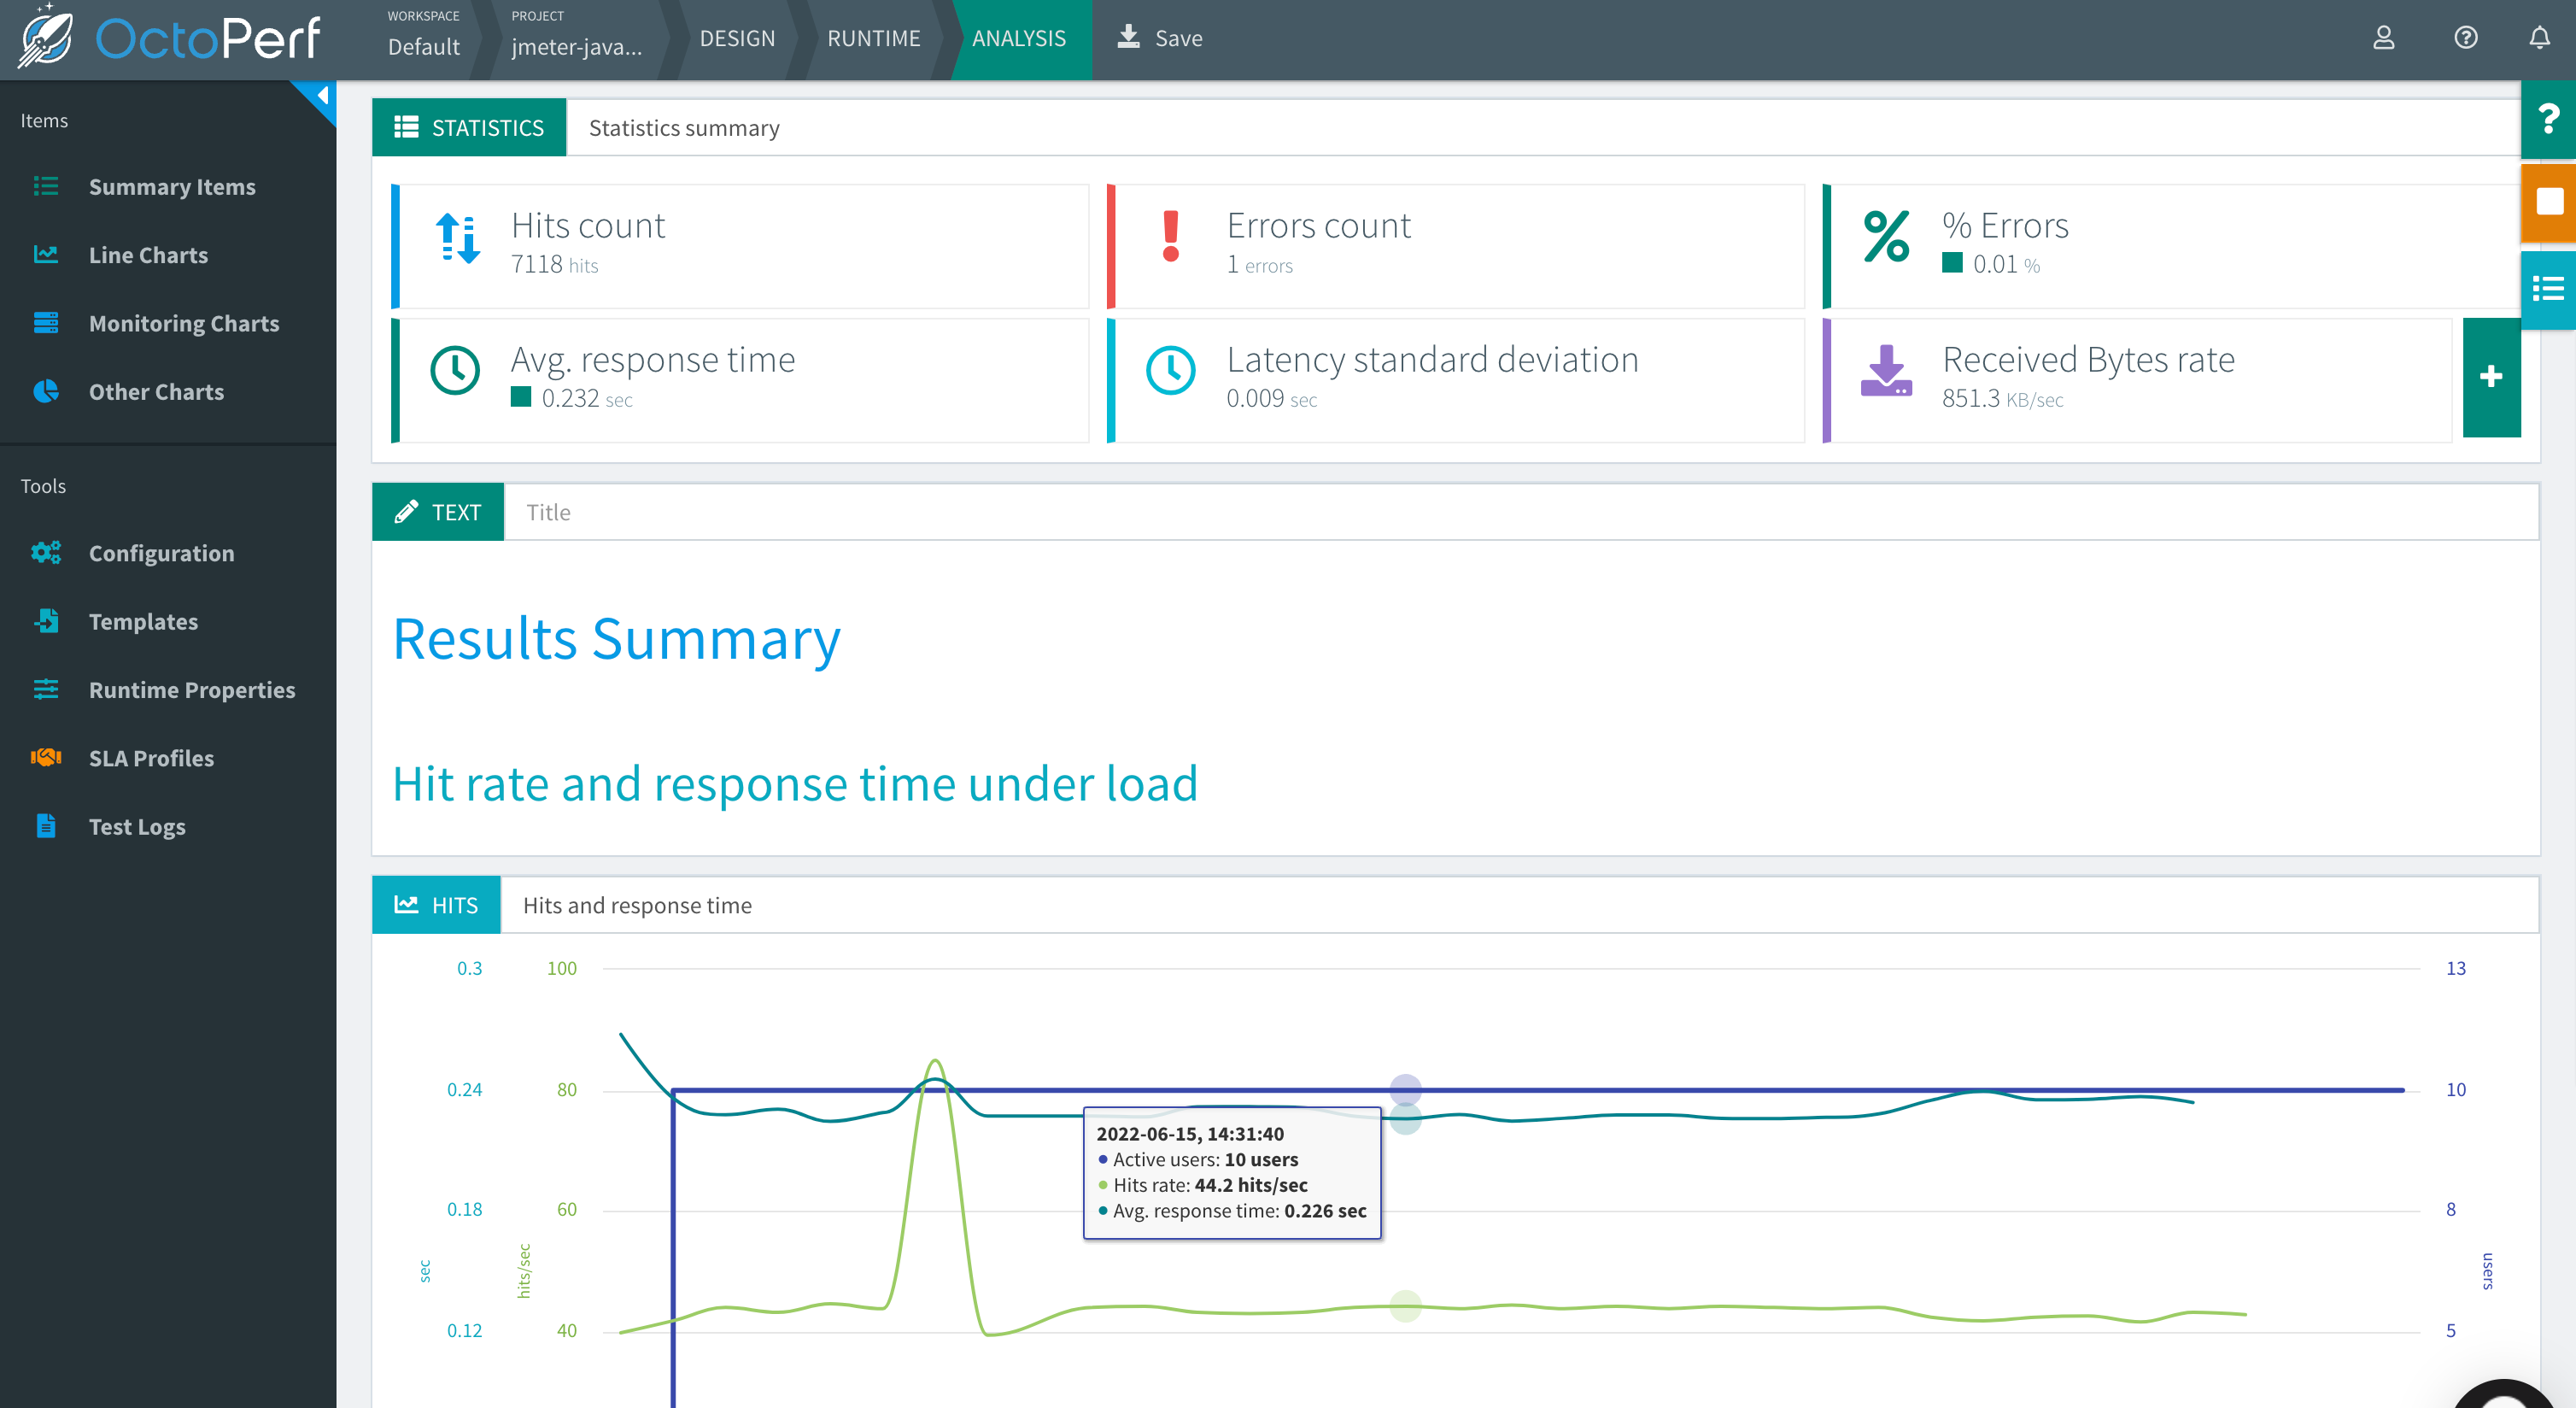
As with the BlazeMeter case, with OctoPerf you can not only run the test at scale but also get additional features like nice real-time reporting, historic data tracking, etc. Here is an example of how a test looks like in OctoPerf:
Check OctoPerfEngine for details on usage and available settings when running tests in OctoPerf.
WARNING
To avoid piling up virtual users and scenarios in OctoPerf project, OctoPerfEngine deletes any OctoPerfEngine previously created entities (virtual users and scenarios with jmeter-java-dsl tag) in the project.
It is very important that you use different project names for different projects to avoid interference (parallel execution of two jmeter-java-dsl projects).
If you want to disable this automatic cleanup, you can use the existing OctoPerfEngine method .projectCleanUp(false).
TIP
In case you want to get debug logs for HTTP calls to OctoPerf API, you can include the following setting to an existing log4j2.xml configuration file:
<Logger name="us.abstracta.jmeter.javadsl.octoperf.OctoPerfClient" level="DEBUG"/>
<Logger name="okhttp3" level="DEBUG"/>
WARNING
There is currently no built-in support for test elements with Java lambdas in OctoPerfEngine (as there is for BlazeMeterEngine). If you need it, please request it by creating a GitHub issue.
WARNING
By default the engine is configured to timeout if test execution takes more than 1 hour. This timeout exists to avoid any potential problem with OctoPerf execution not detected by the client, and avoid keeping the test indefinitely running until is interrupted by a user, which is specially annoying when running tests in automated fashion, for example in CI/CD. It is strongly advised to set this timeout properly in each run, according to the expected test execution time plus some additional margin (to consider for additional delays in OctoPerf test setup and teardown) to avoid unexpected test plan execution failure (due to timeout) or unnecessary waits when there is some unexpected issue with OctoPerf execution.
Azure Load Testing
To use Azure Load Testing to execute your test plans at scale, is as easy as including the following module as a dependency:
<dependency>
  <groupId>us.abstracta.jmeter</groupId>
  <artifactId>jmeter-java-dsl-azure</artifactId>
  <version>2.2</version>
  <scope>test</scope>
</dependency>
testImplementation 'us.abstracta.jmeter:jmeter-java-dsl-azure:2.2'
And using the provided engine like this:
import static org.assertj.core.api.Assertions.assertThat;
import static us.abstracta.jmeter.javadsl.JmeterDsl.*;

import java.time.Duration;
import org.junit.jupiter.api.Test;
import us.abstracta.jmeter.javadsl.azure.AzureEngine;
import us.abstracta.jmeter.javadsl.core.TestPlanStats;

public class PerformanceTest {

  @Test
  public void testPerformance() throws Exception {
    TestPlanStats stats = testPlan(
        threadGroup(2, 10,
            httpSampler("http://my.service")
        )
    ).runIn(new AzureEngine(System.getenv("AZURE_CREDS")) // AZURE_CREDS=tenantId:clientId:secretId
        .testName("dsl-test")
        /*
        This specifies the number of engine instances used to execute the test plan.
        In this case means that it will run 2(threads in thread group)x2(engines)=4 concurrent users/threads in total.
        Each engine executes the test plan independently.
         */
        .engines(2)
        .testTimeout(Duration.ofMinutes(20)));
    assertThat(stats.overall().sampleTimePercentile99()).isLessThan(Duration.ofSeconds(5));
  }

}
This test is using
AZURE_CREDS, a custom environment variable containingtenantId:clientId:clientSecretwith proper values for each. Check in Azure Portal tenant properties the proper tenant ID for your subscription, and follow this guide to register an application with proper permissions and secrets generation for tests execution.
As with the BlazeMeter and OctoPerf, you can not only run the test at scale but also get additional features like nice real-time reporting, historic data tracking, etc. Here is an example of how a test looks like in Azure Load Testing:
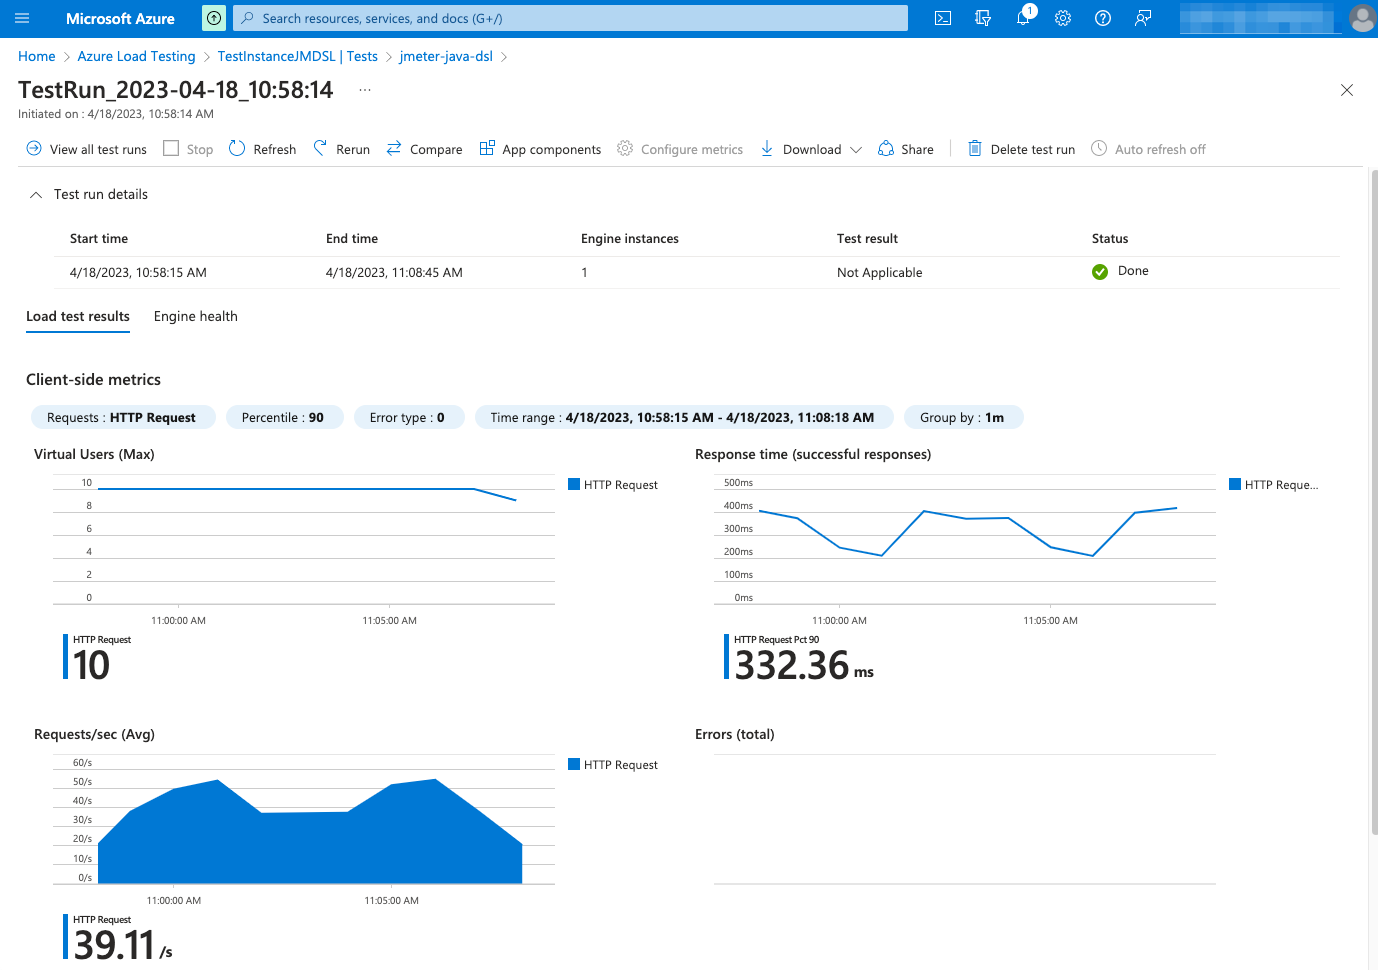
Check AzureEngine for details on usage and available settings when running tests in Azure Load Testing.
TIP
AzureEngine will automatically upload to Azure Load Testing files used in csvDataSet and httpSampler with bodyFile or bodyFilePart methods.
For example this test plan works out of the box (no need for uploading referenced files or adapt test plan):
testPlan(
    threadGroup(100, Duration.ofMinutes(5),
      csvDataSet(new TestResource("users.csv")),
      httpSampler(SAMPLE_LABEL, "https://myservice/users/${USER}")
    )
).runIn(new AzureEngine(System.getenv("BZ_TOKEN"))
    .testTimeout(Duration.ofMinutes(10)));
If you need additional files to be uploaded to Azure Load Testing, you can easily specify them with the AzureEngine.assets() method.
TIP
If you use a csvDataSet and multiple Azure engines (through the engines() method) and want to split provided CSVs between the Azure engines, as to not generate same requests from each engine, then you can use splitCsvsBetweenEngines.
TIP
If you want to correlate test runs to other entities (like a CI/CD job id, product version release, git commit, etc) you can add such information in the test run name by using the testRunName() method.
TIP
To get a full view in Azure Load Testing test run execution report not only of the performance test collected metrics, but also metrics from the application components under test, you can register all the application components using the monitoredResources() method.
monitoredResources() requires a list of resources ids, which you can get by navigating in Azure portal to the correct resource, and then copy part of the url from the browser. For example, a resource id for a container app looks like /subscriptions/my-subscription-id/resourceGroups/my-resource-group/providers/Microsoft.App/containerapps/my-papp.
TIP
As with BlazeMeter and OctoPerf cases, if you want to get debug logs for HTTP calls to Azure API, you can include the following setting to an existing log4j2.xml configuration file:
<Logger name="us.abstracta.jmeter.javadsl.azure.AzureClient" level="DEBUG"/>
<Logger name="okhttp3" level="DEBUG"/>
WARNING
There is currently no built-in support for test elements with Java lambdas in AzureEngine (as there is for BlazeMeterEngine). If you need it, please request it by creating a GitHub issue.
WARNING
By default the engine is configured to timeout if test execution takes more than 1 hour. This timeout exists to avoid any potential problem with Azure Load Testing execution not detected by the client, and avoid keeping the test indefinitely running until is interrupted by a user, which may incur in unnecessary expenses in Azure and is specially annoying when running tests in automated fashion, for example in CI/CD. It is strongly advised to set this timeout properly in each run, according to the expected test execution time plus some additional margin (to consider for additional delays in Azure Load Testing test setup and teardown) to avoid unexpected test plan execution failure (due to timeout) or unnecessary waits when there is some unexpected issue with Azure Load Testing execution.
JMeter remote testing
JMeter already provides means to run a test on several machines controlled by one master/client machine. This is referred as Remote Testing.
JMeter remote testing requires setting up nodes in server/slave mode (using bin/jmeter-server JMeter script) with a configured keystore (usually rmi_keystore.jks, generated with bin/ JMeter script) which will execute a test plan triggered in a client/master node.
You can trigger such tests with the DSL using DistributedJmeterEngine as in the following example:
import static org.assertj.core.api.Assertions.assertThat;
import static us.abstracta.jmeter.javadsl.JmeterDsl.*;

import java.time.Duration;
import org.junit.jupiter.api.Test;
import us.abstracta.jmeter.javadsl.core.engines.DistributedJmeterEngine;
import us.abstracta.jmeter.javadsl.core.TestPlanStats;

public class PerformanceTest {

  @Test
  public void testPerformance() throws Exception {
    TestPlanStats stats = testPlan(
        threadGroup(200, Duration.ofMinutes(10),
            httpSampler("http://my.service")
        )
    ).runIn(new DistributedJmeterEngine("host1", "host2"));
    assertThat(stats.overall().sampleTimePercentile99()).isLessThan(Duration.ofSeconds(5));
  }

}
This will run 200 users for 10 minutes on each server/slave (host1 and host2) and aggregate all the results in returned stats.
WARNING
Use same version used by JMeter DSL when setting up the cluster to avoid any potential issues.
For instance, JMeter 5.6 has introduced some changes that currently break some plugins using by JMeter DSL, or change default behavior for test plans.
To find out the current version of JMeter DSL you can check JMeter jars version in your project dependency tree. E.g.:
mvn dependency:tree -Dincludes=org.apache.jmeter:ApacheJMeter_core
Or check JMeter DSL pom.xml property jmeter.version.
WARNING
To be able to run the test you require the rmi_keystore.jks file in the working directory of the test. For the time being, we couldn't find a way to allow setting any arbitrary path for the file.
WARNING
In general, prefer using BlazeMeter, OctoPerf or Azure options which avoid all the setup and maintenance costs of the infrastructure required by JMeter remote testing, also benefiting from other additional useful features they provide (like reporting capabilities).
TIP
Here is an example project using docker-compose that starts a JMeter server/slave and executes a test with it. If you want to do a similar setup, generate your own keystore and properly tune RMI remote server in server/slave.
Check DistributedJmeterEngine and JMeter documentation for proper setup and additional options.
Auto Stop
As previously shown, it is quite easy to check after test plan execution if the collected metrics are the expected ones and fail/pass the test accordingly.
But, what if you want to stop your test plan as soon as the metrics deviate from expected ones? This could help avoiding unnecessary resource usage, especially when conducting tests at scale to avoid incurring additional costs.
With JMeter DSL you can easily define auto-stop conditions over collected metrics, that when met will stop the test plan and throw an exception that will make your test fail.
Here is an example:
import static us.abstracta.jmeter.javadsl.JmeterDsl.*;
import static us.abstracta.jmeter.javadsl.core.listeners.AutoStopListener.AutoStopCondition.*;

import java.io.IOException;
import java.time.Duration;
import org.junit.jupiter.api.Test;
import us.abstracta.jmeter.javadsl.core.TestPlanStats;

public class PerformanceTest {

  @Test
  public void testPerformance() throws IOException {
    TestPlanStats stats = testPlan(
        threadGroup(2, Duration.ofMinutes(1),
          httpSampler("http://my.service")
        ),
        autoStop()
          .when(errors().total().greaterThan(0)) // when any sample fails, then test plan will stop and an exception will be thrown pointing to this condition.
    ).run();
  }

}
Check AutoStopListener for details on available options for auto-stop conditions.
autoStop is inspired in JMeter AutoStop Plugin, but provides a lot more flexibility.
TIP
autoStop will only consider samples within its scope.
If you place it as a test plan child, then it will evaluate metrics for all samples. If you place it as a thread group child, then it will evaluate metrics for samples of such thread group. If you place it as a controller child, then only samples within such controller. And, if you place it as a sampler child, it will only evaluate samples for that particular sampler.
Additionally, you can use the samplesMatching(regex) method to only evaluate metrics for a subset of samples within a given scope (eg: all samples with a label starting with users).
TIP
You can add multiple autoStop elements within a test plan. The first one containing a condition that is met will trigger the auto-stop.
To identify which autoStop element triggered, you can specify a name, like autoStop("login"), and the associated name will be included in the exception thrown by autoStop when the test plan is stopped.
Additionally, you can specify several conditions on an autoStop element. When any of such conditions are met, then the test plan is stopped.
TIP
By default, autoStop will evaluate each condition for each sample and stop the test plan as soon as a condition is met.
This behavior is different from JMeter AutoStop Plugin, which evaluates and resets aggregations (it only provides average aggregation) for every second.
To change this behavior you can use the every(Duration) method (after specifying the aggregation method, eg errors().perSecond().every(Duration.ofSeconds(5)))) to specify that the condition should only be evaluated, and the aggregation reset, for every given period.
This is particularly helpful for some aggregations (like mean, perSecond, and percent) which may get "stuck" due to historical values collected for the metric.
As an example to illustrate this issue, consider the scenario where after 10 minutes you get 10k requests with an average sample time of 1 second, but in the last 10 seconds you get 10 requests with an average of 10 seconds. In this scenario, the general average will not be much affected by the last seconds, but you would in any case want to stop the test plan since last seconds average has been way up the expected value. This is a clear scenario where you would like to use the every() method.
TIP
By default, autoStop will stop the test plan as soon as the condition is met, but in many cases it is better to wait for the condition to be met for some period of time, to avoid some intermittent or short-lived condition. To not stop the test plan until the condition holds for a given period of time, you can use holdsFor(Duration) at the end of your condition.
WARNING
autoStop will automatically work with AzureEngine. But no support has been implemented yet for BlazeMeterEngine or OctoPerfEngine. If you need such support, please create an issue in the GitHub repository.
Advanced threads configuration
jmeter-java-dsl provides two simple ways of creating thread groups which are used in most scenarios:
- specifying threads and the number of iterations each thread should execute before ending the test plan
- specifying threads and duration for which each thread should execute before the test plan ends
This is how they look in code:
threadGroup(10, 20, ...) // 10 threads for 20 iterations each
threadGroup(10, Duration.ofSeconds(20), ...) // 10 threads for 20 seconds each
But these options are not good when working with many threads or when trying to configure some complex test scenarios (like when doing incremental or peak tests).
Thread ramps and holds
When working with many threads, it is advisable to configure a ramp-up period, to avoid starting all threads at once affecting performance metrics and generation.
You can easily configure a ramp-up with the DSL like this:
threadGroup().rampTo(10, Duration.ofSeconds(5)).holdIterating(20) // ramp to 10 threads for 5 seconds (1 thread every half second) and iterating each thread 20 times
threadGroup().rampToAndHold(10, Duration.ofSeconds(5), Duration.ofSeconds(20)) //similar as above but after ramping up holding execution for 20 seconds
Additionally, you can use and combine these same methods to configure more complex scenarios (incremental, peak, and any other types of tests) like the following one:
threadGroup()
    .rampToAndHold(10, Duration.ofSeconds(5), Duration.ofSeconds(20))
    .rampToAndHold(100, Duration.ofSeconds(10), Duration.ofSeconds(30))
    .rampTo(200, Duration.ofSeconds(10))
    .rampToAndHold(100, Duration.ofSeconds(10), Duration.ofSeconds(30))
    .rampTo(0, Duration.ofSeconds(5))
    .children(
      httpSampler("http://my.service")
    )
Which would translate into the following threads' timeline:
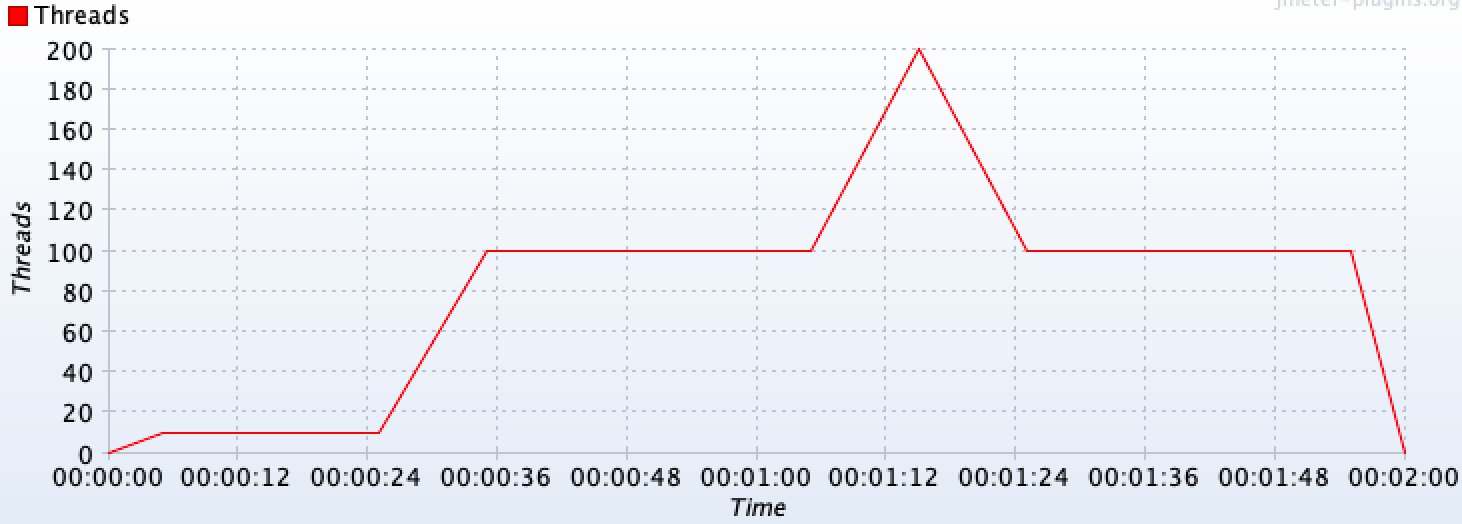
Check DslDefaultThreadGroup for more details.
TIP
To visualize the threads timeline, for complex thread group configurations like the previous one, you can get a chart like the previous one by using provided DslThreadGroup.showTimeline() method.
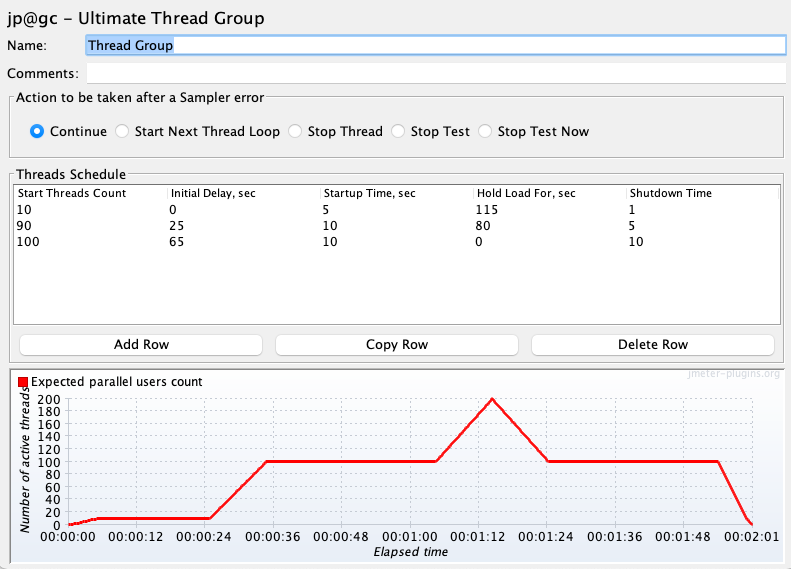
TIP
If you are a JMeter GUI user, you may even be interested in using provided TestElement.showInGui() method, which shows the JMeter test element GUI that could help you understand what will DSL execute in JMeter. You can use this method with any test element generated by the DSL (not just thread groups).
For example, for the above test plan you would get a window like the following one:
TIP
When using multiple thread groups in a test plan, consider setting a name (eg: threadGroup("main", 1, 1, ...)) on them to properly identify associated requests in statistics & jtl results.
Throughput based thread group
Sometimes you want to focus just on the number of requests per second to generate and don't want to be concerned about how many concurrent threads/users, and pauses between requests, are needed. For these scenarios you can use rpsThreadGroup like in the following example:
rpsThreadGroup()
    .maxThreads(500)
    .rampTo(20, Duration.ofSeconds(10))
    .rampTo(10, Duration.ofSeconds(10))
    .rampToAndHold(1000, Duration.ofSeconds(5), Duration.ofSeconds(10))
    .children(
      httpSampler("http://my.service")
    )
This will internally use JMeter Concurrency Thread Group element in combination with Throughput Shaping Time.
TIP
rpsThreadGroup will dynamically create and remove threads and add delays between requests to match the traffic to the expected RPS. You can also specify to control iterations per second (the number of times the flow in the thread group runs per second) instead of threads by using .counting(RpsThreadGroup.EventType.ITERATIONS).
WARNING
RPS values control how often to adjust threads and waits. Avoid too low (eg: under 1) values which can cause big waits and don't match the expected RPS.
JMeter Throughput Shaping Timer calculates each time the delay to be used not taking into consideration future expected RPS. For instance, if you configure 1 thread with a ramp from 0.01 to 10 RPS with 10 seconds duration, when 1 request is sent it will calculate that to match 0.01 RPS has to wait requestsCount/expectedRPS = 1/0.01 = 100 seconds, which would keep the thread stuck for 100 seconds when in fact should have done two additional requests after waiting 1 second (to match the ramp). Setting this value greater or equal to 1 will assure at least 1 evaluation every second.
WARNING
When no maxThreads are specified, rpsThreadGroup will use as many threads as needed. In such scenarios, you might face an unexpected number of threads with associated CPU and Memory requirements, which may affect the performance test metrics. You should always set maximum threads to use to avoid such scenarios.
You can use the following formula to calculate a value for maxThreads: T*R, being T the maximum RPS that you want to achieve and R the maximum expected response time (or iteration time if you use .counting(RpsThreadGroup.EventType.ITERATIONS)) in seconds.
TIP
As with the default thread group, with rpsThreadGroup you can use showTimeline to get a chart of configured RPS profile for easy visualization. An example chart:
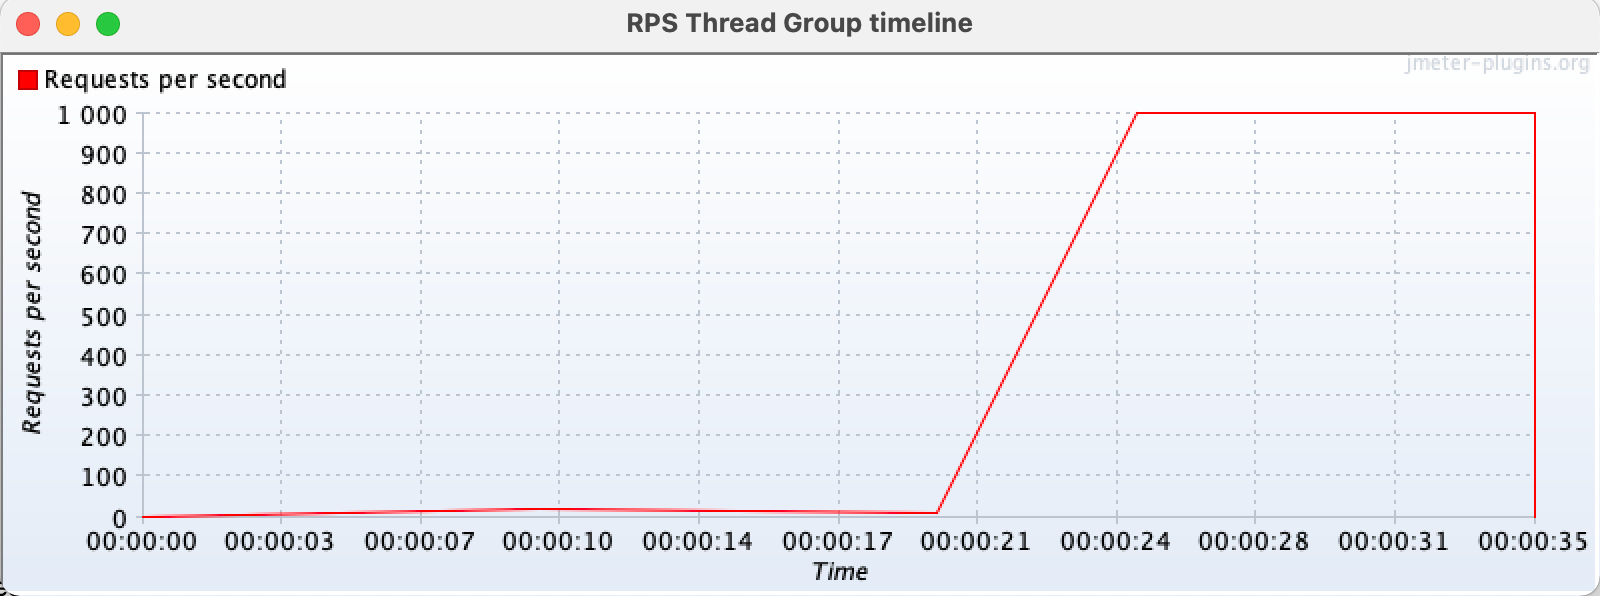
Check RpsThreadGroup for more details.
Set up & tear down
When you need to run some custom logic before or after a test plan, the simplest approach is just adding plain java code to it, or using your test framework (eg: JUnit) provided features for this purpose. Eg:
import static org.assertj.core.api.Assertions.assertThat;
import static us.abstracta.jmeter.javadsl.JmeterDsl.*;

import java.io.IOException;
import java.time.Duration;
import org.junit.jupiter.api.Test;
import org.junit.jupiter.api.BeforeEach;
import org.junit.jupiter.api.AfterEach;
import us.abstracta.jmeter.javadsl.core.TestPlanStats;

public class PerformanceTest {

  @BeforeEach
  public void setup() {
    // my custom setup logic
  }

  @AfterEach
  public void setup() {
    // my custom setup logic
  }

  @Test
  public void testPerformance() throws IOException {
    TestPlanStats stats = testPlan(
        threadGroup(2, 10,
            httpSampler("http://my.service")
        )
    ).run();
    assertThat(stats.overall().sampleTimePercentile99()).isLessThan(Duration.ofSeconds(5));
  }

}
But, in some cases you may need the logic to run inside the JMeter execution context (eg: set some JMeter properties), or, when the test plan runs at scale, to run in the same host where the test plan runs (for example to use some common file).
In such scenarios you can use provided setupThreadGroup & teardownThreadGroup like in the following example:
import static org.assertj.core.api.Assertions.assertThat;
import static us.abstracta.jmeter.javadsl.JmeterDsl.*;

import java.io.IOException;
import java.time.Duration;
import org.apache.jmeter.protocol.http.util.HTTPConstants;
import org.junit.jupiter.api.Test;
import us.abstracta.jmeter.javadsl.core.TestPlanStats;

public class PerformanceTest {

  @Test
  public void testPerformance() throws IOException {
    TestPlanStats stats = testPlan(
        setupThreadGroup(
            httpSampler("http://my.service/tokens")
                .method(HTTPConstants.POST)
                .children(
                    jsr223PostProcessor("props.put('MY_TEST_TOKEN', prev.responseDataAsString)")
                )
        ),
        threadGroup(2, 10,
            httpSampler("http://my.service/products")
                .header("X-MY-TOKEN", "${__P(MY_TEST_TOKEN)}")
        ),
        teardownThreadGroup(
            httpSampler("http://my.service/tokens/${__P(MY_TEST_TOKEN)}")
                .method(HTTPConstants.DELETE)
        )
    ).run();
    assertThat(stats.overall().sampleTimePercentile99()).isLessThan(Duration.ofSeconds(5));
  }

}
TIP
By default, JMeter automatically executes teardown thread groups when a test plan stops due to an unscheduled event like a sample error when a stop test action is configured in a thread group, invocation of ctx.getEngine().askThreadsToStop() in jsr223 element, etc. You can disable this behavior by using the testPlan tearDownOnlyAfterMainThreadsDone method, which might be helpful if the teardown thread group has only to run on clean test plan completion.
Check DslSetupThreadGroup and DslTeardownThreadGroup for additional tips and details on the usage of these components.
Thread groups order
By default, when you add multiple thread groups to a test plan, JMeter will run them all in parallel. This is a very helpful behavior in many cases, but in some others, you may want to run them sequentially (one after the other). To achieve this you can just use sequentialThreadGroups() test plan method.
Test plan debugging
A usual requirement while building a test plan is to be able to review requests and responses and debug the test plan for potential issues in the configuration or behavior of the service under test. With jmeter-java-dsl you have several options for this purpose.
View results tree
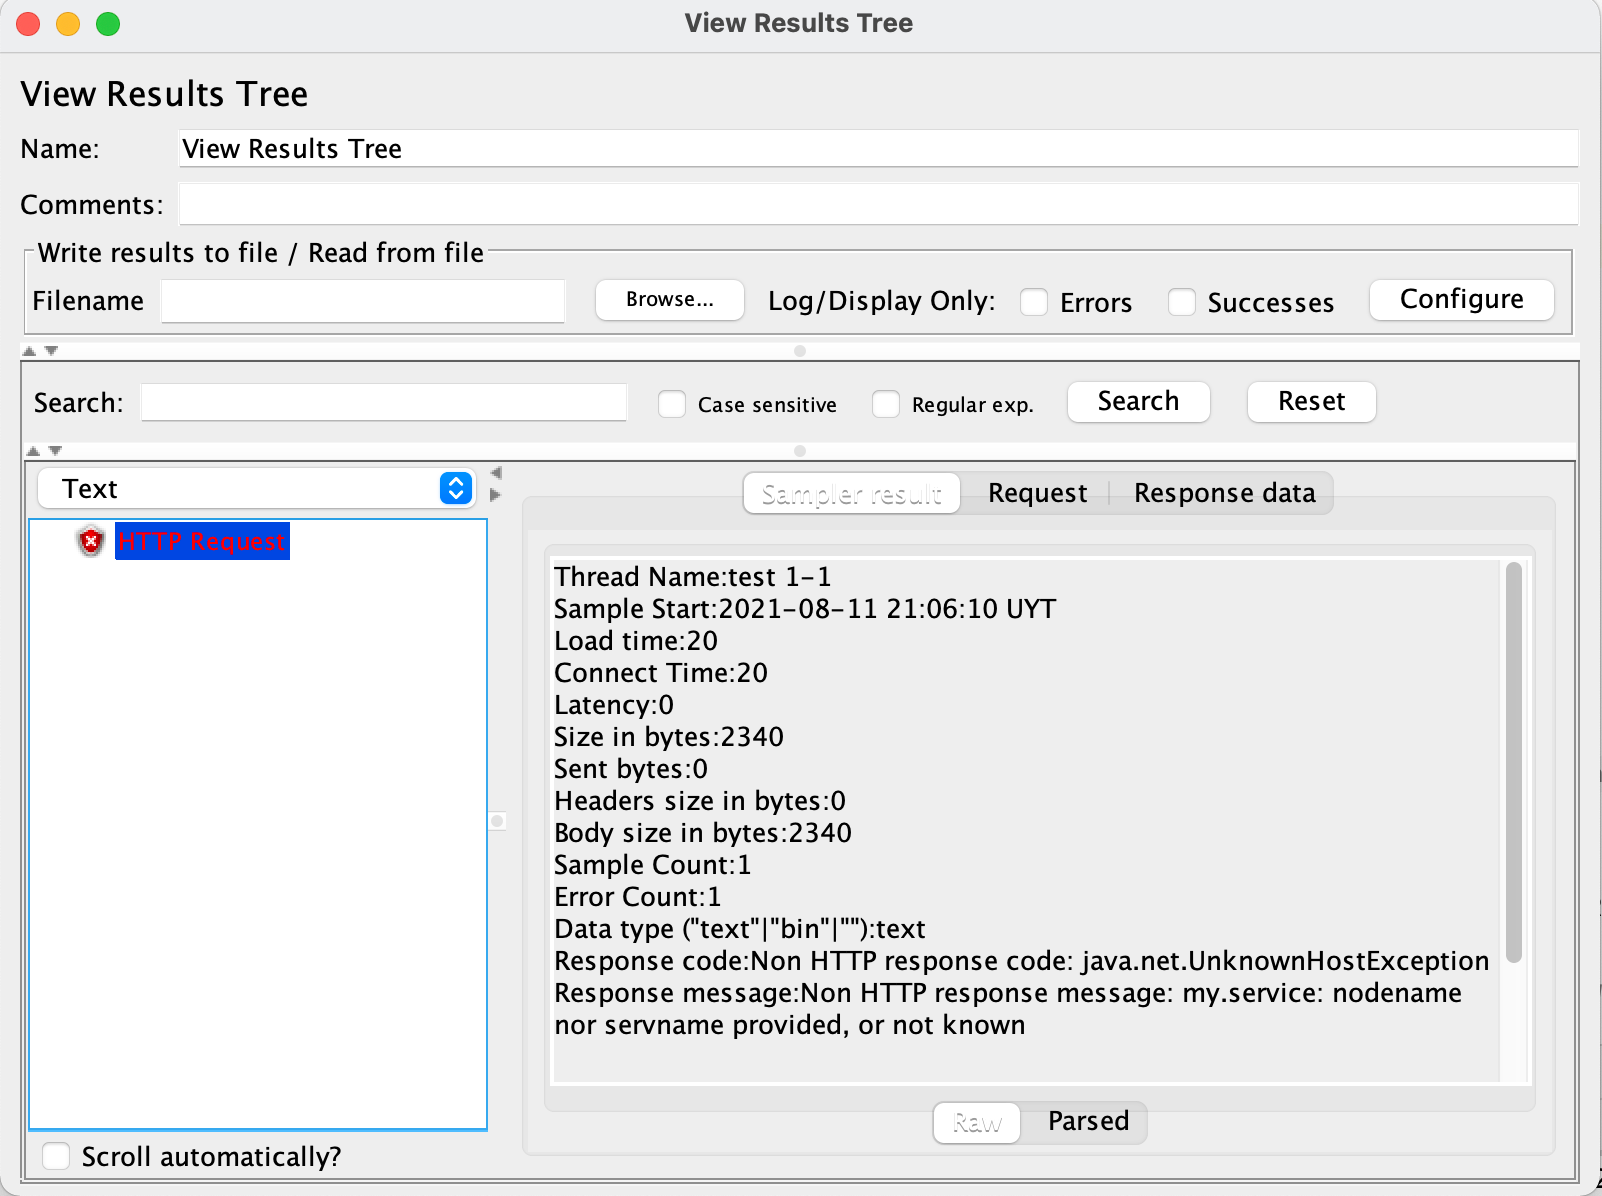
One option is using provided resultsTreeVisualizer() like in the following example:
import static us.abstracta.jmeter.javadsl.JmeterDsl.*;

import java.io.IOException;
import org.junit.jupiter.api.Test;

public class PerformanceTest {

  @Test
  public void testPerformance() throws IOException {
    testPlan(
        threadGroup(1, 1,
            httpSampler("http://my.service")
        ),
        resultsTreeVisualizer()
    ).run();
  }

}
This will display the JMeter built-in View Results Tree element, which allows you to review request and response contents in addition to collected metrics (spent time, sent & received bytes, etc.) for each request sent to the server, in a window like this one:
TIP
To debug test plans use a few iterations and threads to reduce the execution time and ease tracing by having less information to analyze.
TIP
When adding resultsTreeVisualizer() as a child of a thread group, it will only display sample results of that thread group. When added as a child of a sampler, it will only show sample results for that sampler. You can use this to only review certain sample results in your test plan.
TIP
Remove resultsTreeVisualizer() from test plans when are no longer needed (when debugging is finished). Leaving them might interfere with unattended test plan execution (eg: in CI) due to test plan execution not finishing until all visualizers windows are closed.
WARNING
By default, View Results Tree only displays the last 500 sample results. If you need to display more elements, use provided resultsLimit(int) method which allows changing this value. Take into consideration that the more results are shown, the more memory that will require. So use this setting with care.
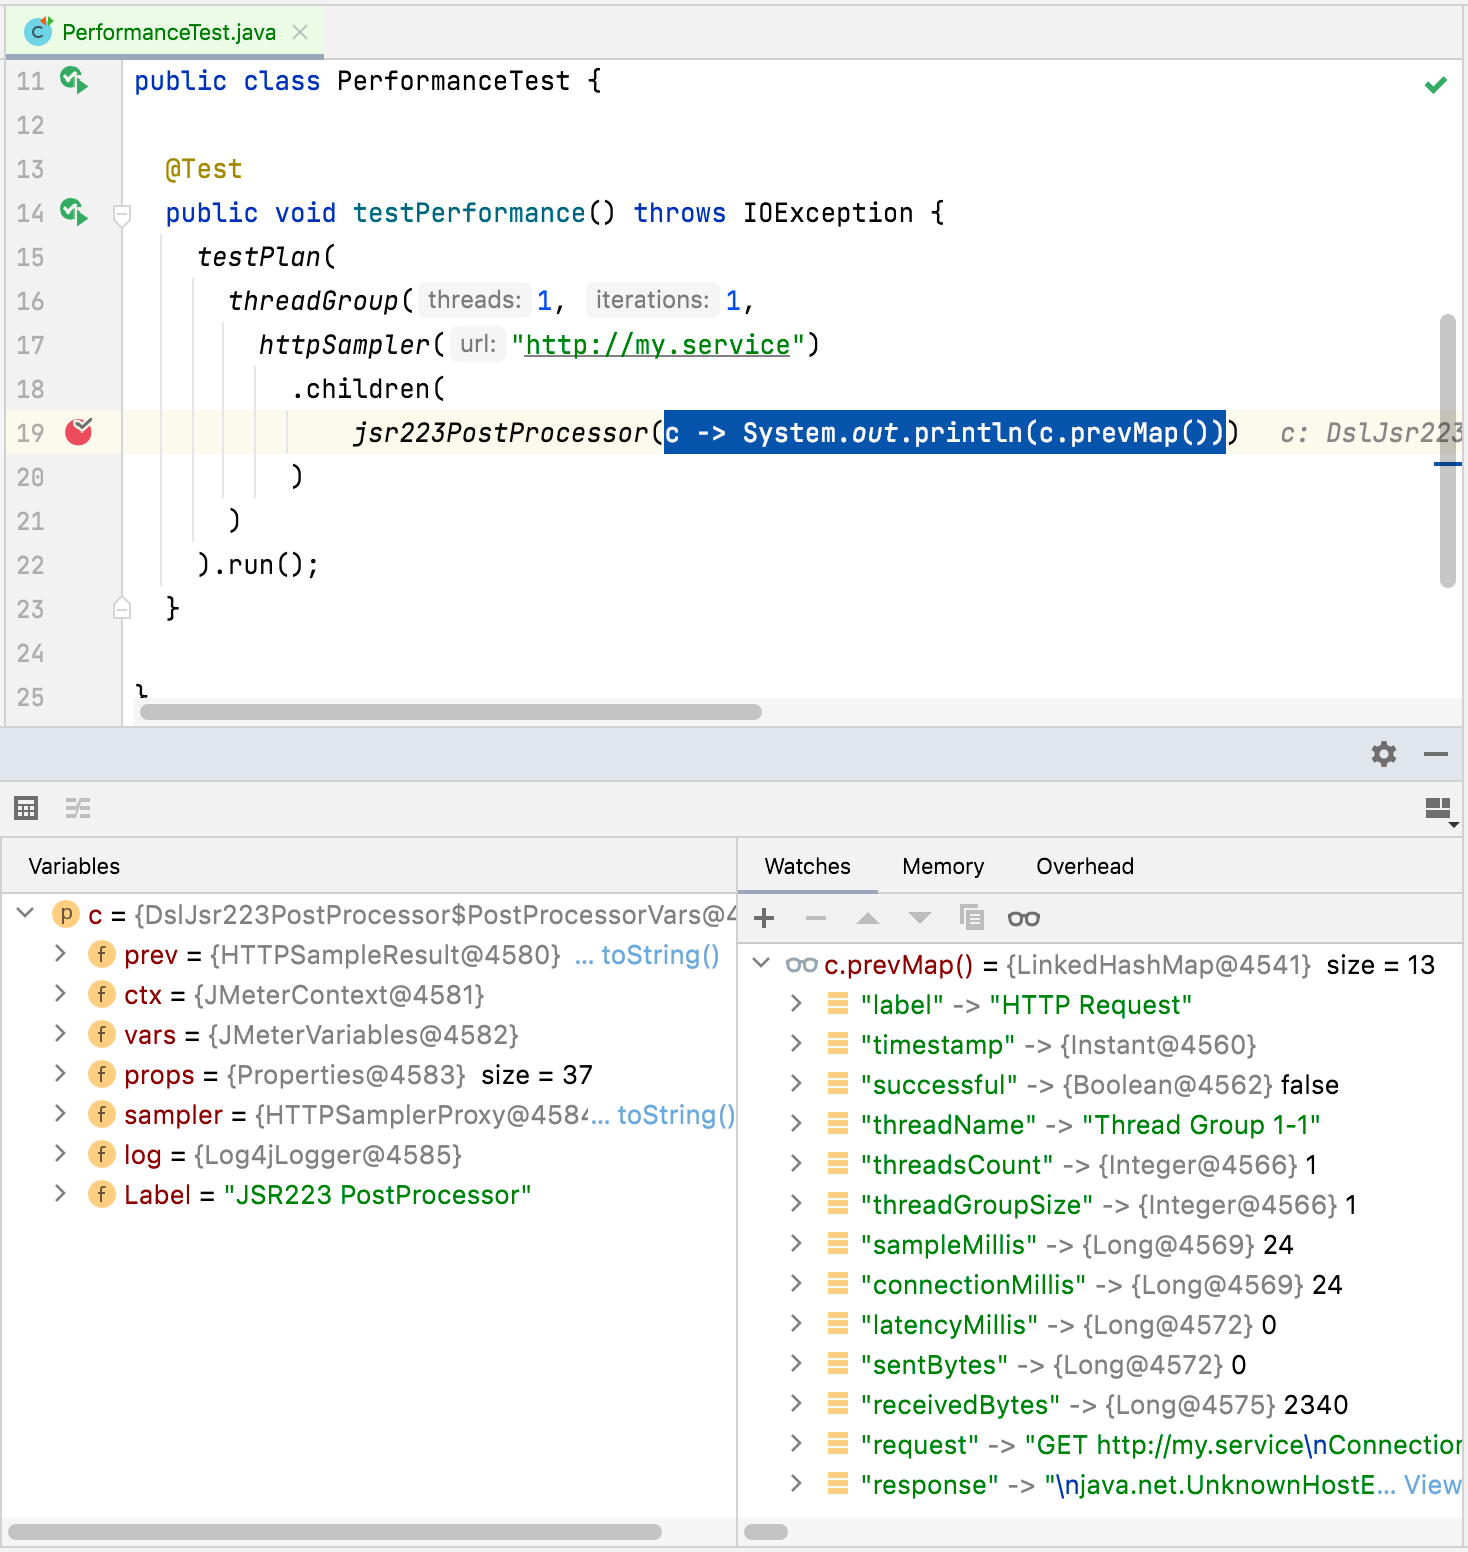
Post-processor breakpoints
Another alternative is using IDE's built-in debugger by adding a jsr223PostProcessor with java code and adding a breakpoint to the post-processor code. This does not only allow checking sample result information but also JMeter variables and properties values and sampler properties.
Here is an example screenshot using this approach while debugging with an IDE:
TIP
DSL provides following methods to ease results and variables visualization and debugging: varsMap(), prevMap(), prevMetadata(), prevMetrics(), prevRequest(), prevResponse(). Check PostProcessorVars and Jsr223ScriptVars for more details.
TIP
Remove such post processors when no longer needed (when debugging is finished). Leaving them would generate errors when loading generated JMX test plan or running the test plan in BlazeMeter, OctoPerf or Azure, in addition to unnecessary processing time and resource usage.
Debug info during test plan execution
Another option that allows collecting debugging information during a test plan execution without affecting test plan execution (doesn't stop the test plan on each breakpoint as IDE debugger does, which will affect test plan collected metrics) and allows analyzing information after test plan execution, is using debugPostProcessor which adds a sub result to sampler results including debug information.
Here is an example that collects JMeter variables that can be reviewed with included resultsTreeVisualizer:
import static us.abstracta.jmeter.javadsl.JmeterDsl.*;

import java.io.IOException;
import org.junit.jupiter.api.Test;

public class PerformanceTest {

  @Test
  public void testPerformance() throws IOException {
    String userIdVarName = "USER_ID";
    String usersPath = "/users";
    testPlan(
        httpDefaults().url("http://my.service"),
        threadGroup(1, 1,
            httpSampler(usersPath)
                .children(
                    jsonExtractor(userIdVarName, "[].id"),
                    debugPostProcessor()
                ),
            httpSampler(usersPath + "/${" + userIdVarName + "}")
        ),
        resultsTreeVisualizer()
    ).run();
  }

}
This approach is particularly helpful when debugging extractors, allowing you to see what JMeter variables were or were not generated by previous extractors.
In general, prefer using Post processor with IDE debugger breakpoint in the initial stages of test plan development, testing with just 1 thread in thread groups, and using this later approach when trying to debug issues that are reproducible only in multiple threads executions or in a particular environment that requires offline analysis (analyze collected information after test plan execution).
TIP
Use this element in combination with resultsTreeVisualizer to review live executions, or use jtlWriter with withAllFields() or saveAsXml(true) and saveResponseData(true) to generate a jtl file for later analysis.
TIP
By default, debugPostProcessor will only include JMeter variables in generated sub sampler, which covers the most used case and keeps memory and disk usage low. debugPostProcessor includes additional methods that allow including other information like sampler properties, JMeter properties, and system properties. Check DslDebugPostProcessor for more details.
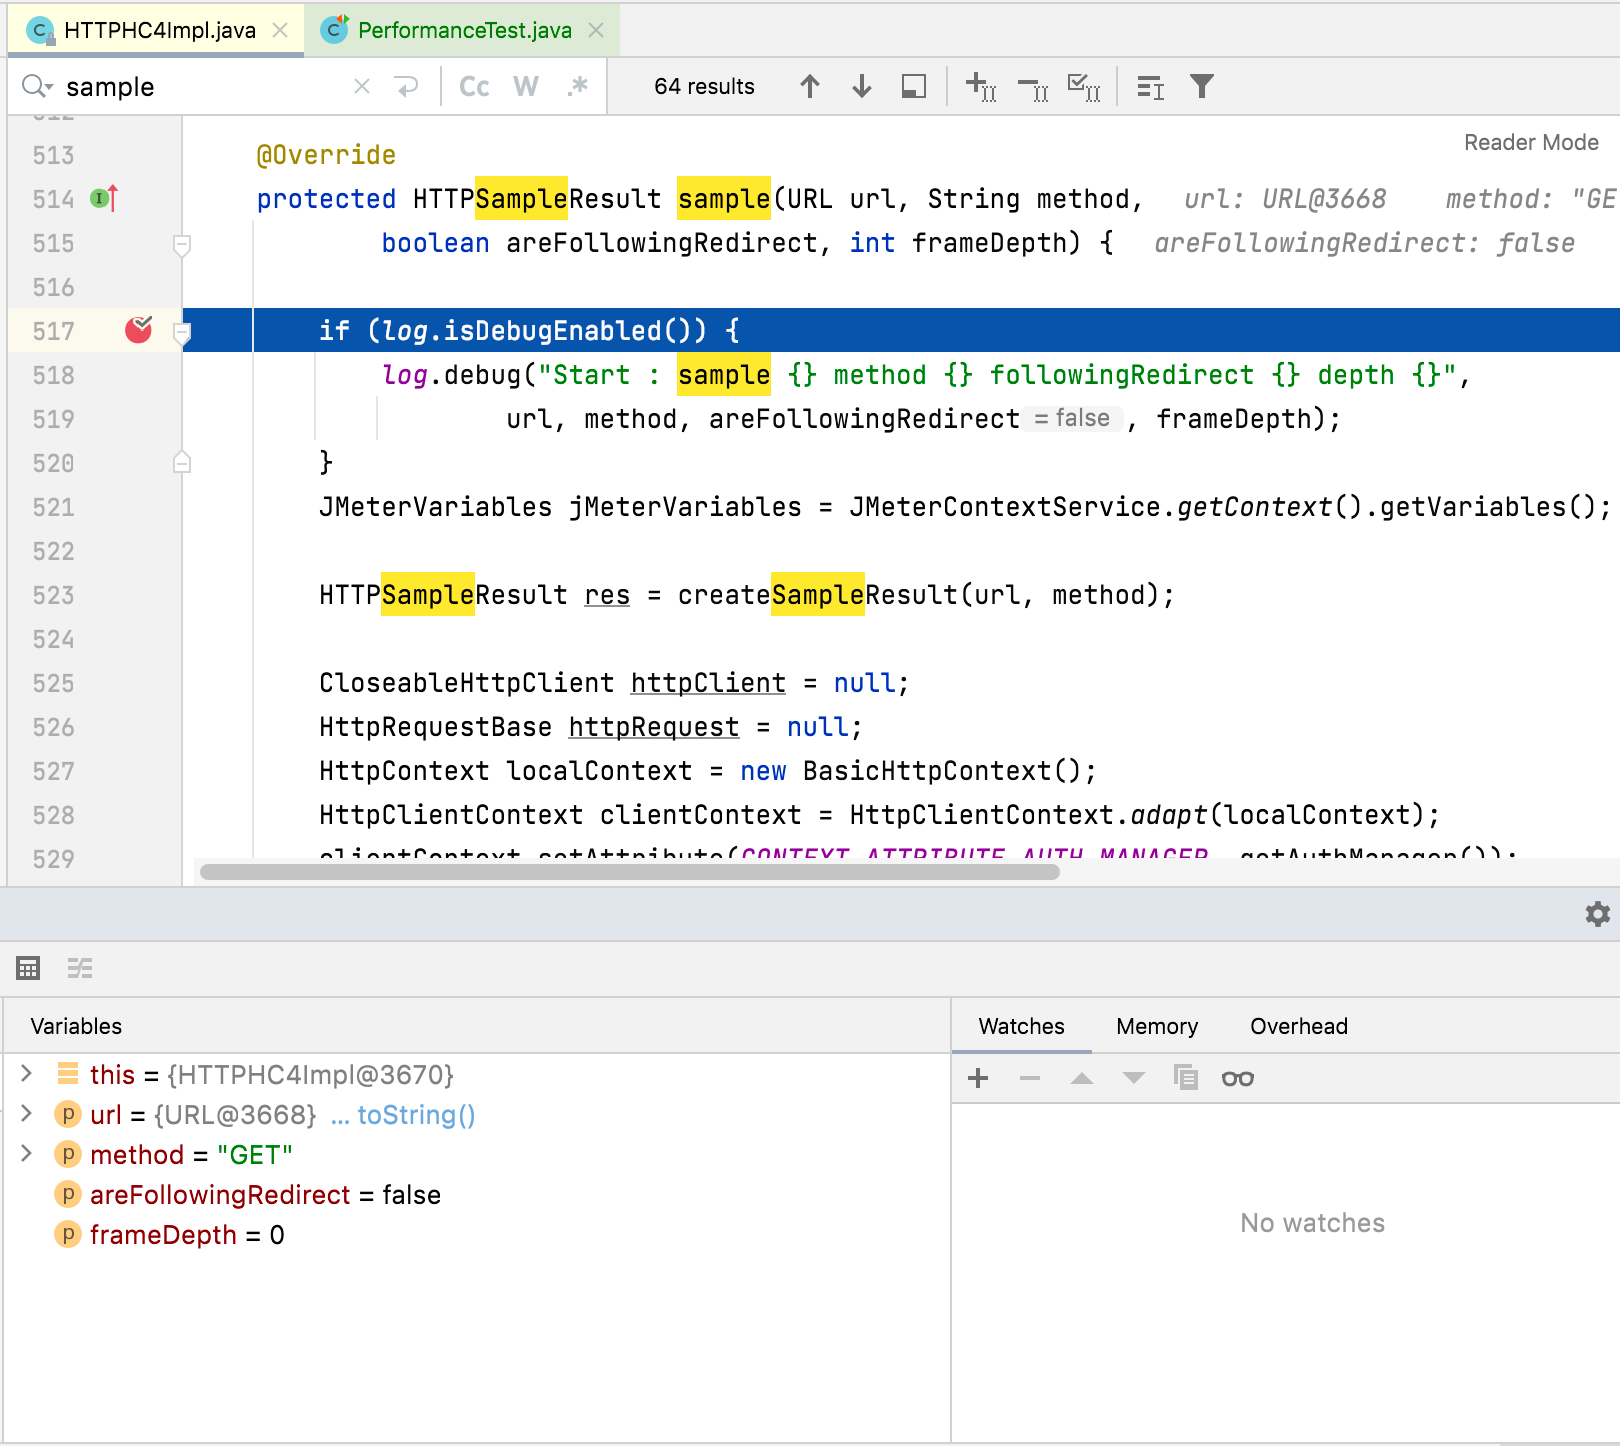
Debug JMeter code
You can even add breakpoints to JMeter code in your IDE and debug the code line by line providing the greatest possible detail.
Here is an example screenshot debugging HTTP Sampler:
TIP
JMeter class in charge of executing threads logic is org.apache.jmeter.threads.JMeterThread. You can check the classes used by each DSL-provided test element by checking the DSL code.
Debug Groovy code
In some cases, you may want to debug some Groovy script used in some sampler, pre-, or post-processor. For such scenarios, you can check here where we list some options.
Dummy sampler
In many cases you want to be able to test part of the test plan but without directly interacting with the service under test, avoiding any potential traffic to the servers, testing some border cases which might be difficult to reproduce with the actual server, and avoid actual server interactions variability and potential unpredictability. In such scenarios, you might replace actual samplers with dummySampler (which uses Dummy Sampler plugin) to be able to test extractors, assertions, controllers conditions, and other parts of the test plan under certain conditions/results generated by the samplers.
Here is an example:
import static us.abstracta.jmeter.javadsl.JmeterDsl.*;

import java.io.IOException;
import org.junit.jupiter.api.Test;

public class PerformanceTest {

  @Test
  public void testPerformance() throws IOException {
    String usersIdVarName = "USER_IDS";
    String userIdVarName = "USER_ID";
    String usersPath = "/users";
    testPlan(
        httpDefaults().url("http://my.service"),
        threadGroup(1, 1,
            // httpSampler(usersPath)
            dummySampler("[{\"id\": 1, \"name\": \"John\"}, {\"id\": 2, \"name\": \"Jane\"}]")
                .children(
                    jsonExtractor(usersIdVarName, "[].id")
                        .matchNumber(-1)
                ),
            forEachController(usersIdVarName, userIdVarName,
                // httpSampler(usersPath + "/${" + userIdVarName + "}")
                dummySampler("{\"name\": \"John or Jane\"}")
                    .url("http://my.service/" + usersPath + "/${" + userIdVarName + "}")
            )
        ),
        resultsTreeVisualizer()
    ).run();
  }

}
TIP
The DSL configures dummy samplers by default, in contrast to what JMeter does, with response time simulation disabled. This allows to speed up the debugging process, not having to wait for proper response time simulation (sleeps/waits). If you want a more accurate emulation, you might turn it on through responseTimeSimulation() method.
Check DslDummySampler for more information o additional configuration and options.
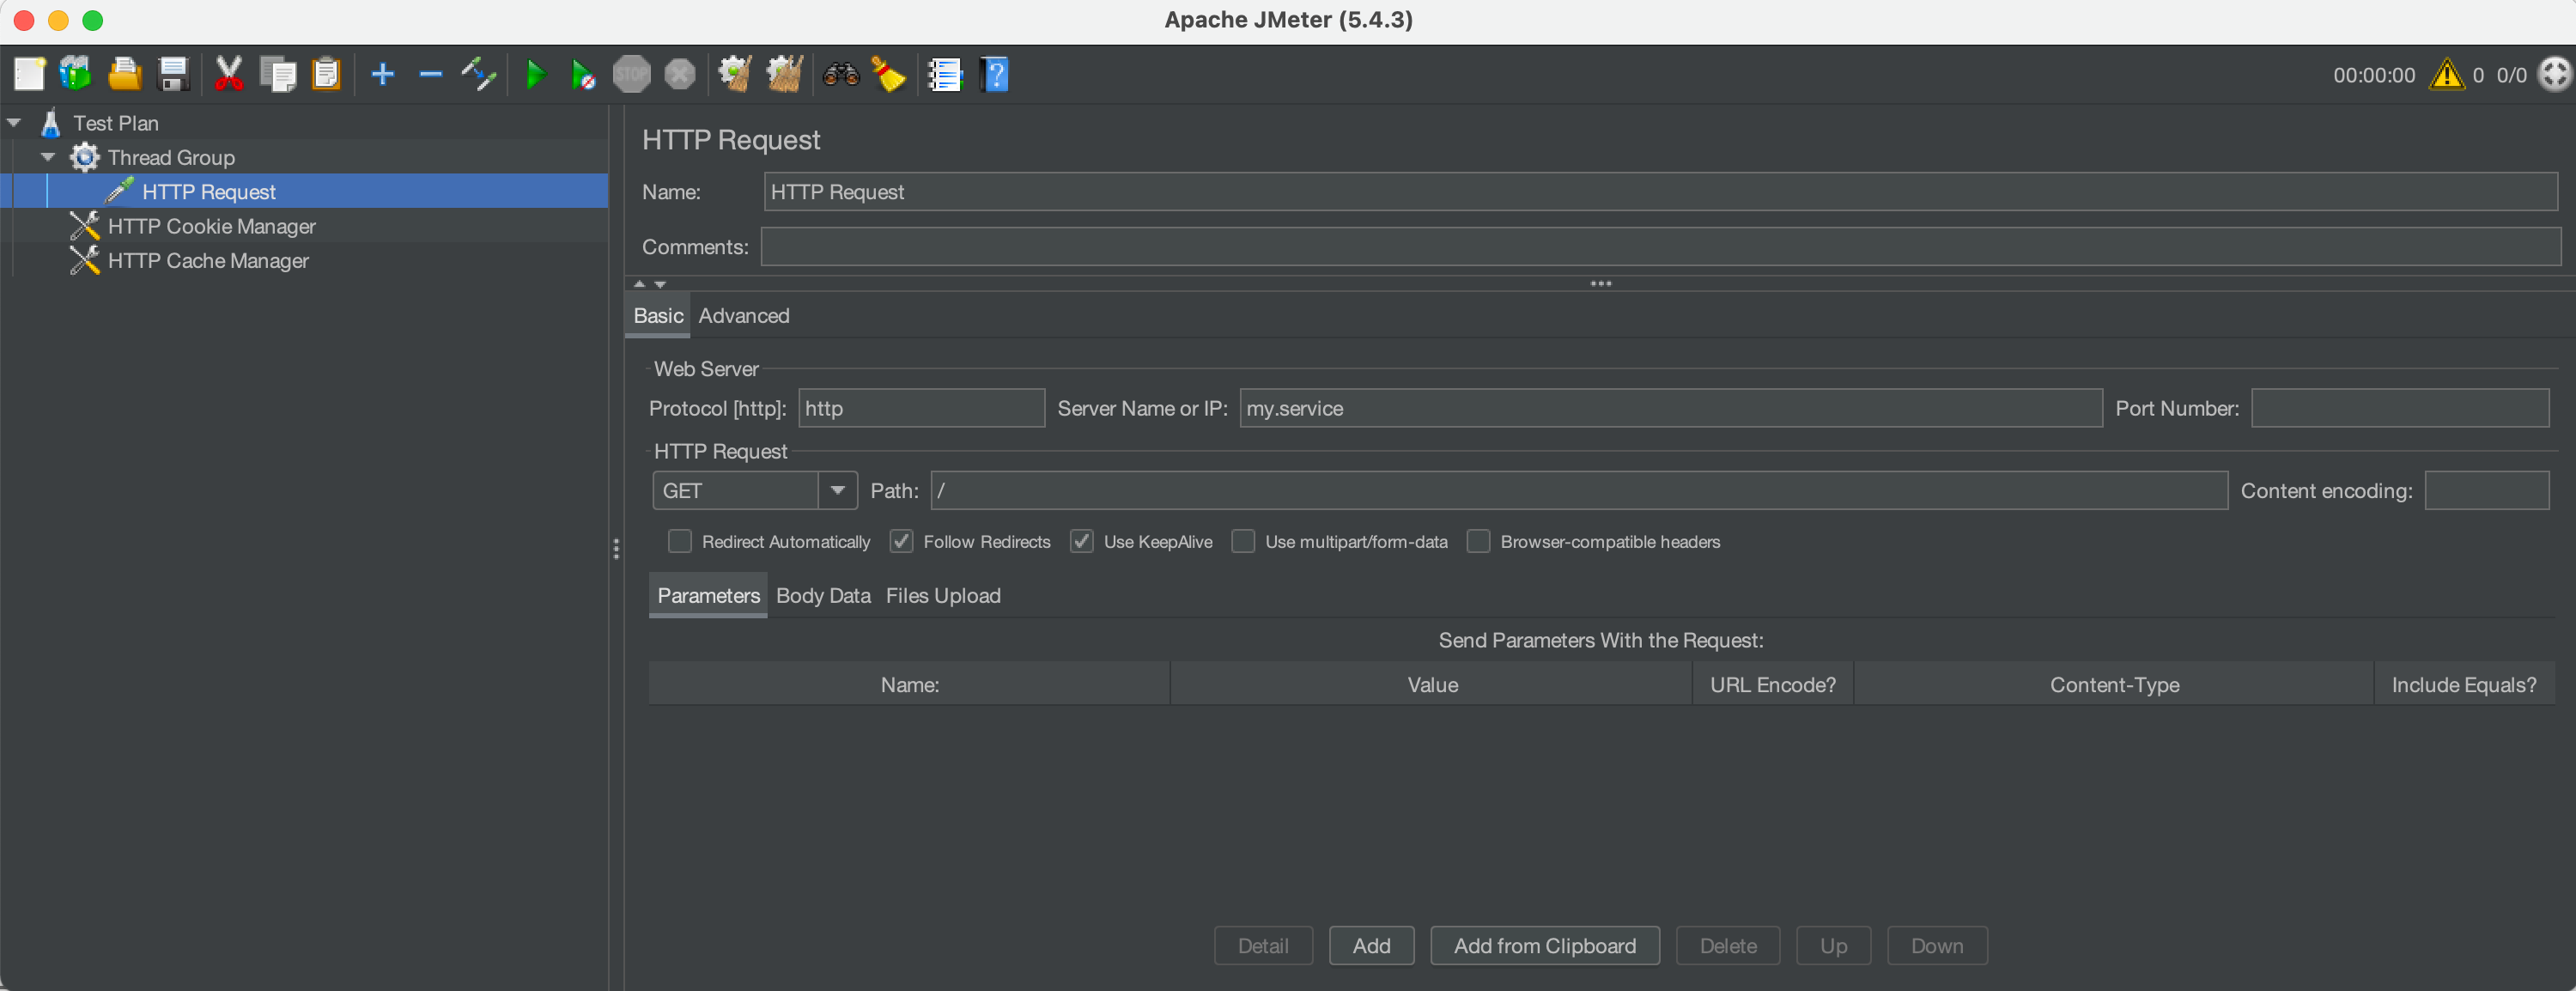
Test plan review in JMeter GUI
A usual requirement for new DSL users that are used to Jmeter GUI, is to be able to review Jmeter DSL generated test plan in the familiar JMeter GUI. For this, you can use showInGui() method in a test plan to open JMeter GUI with the preloaded test plan.
This can be also used to debug the test plan, by adding elements (like view results tree, dummy samplers, debug post-processors, etc.) in the GUI and running the test plan.
Here is a simple example using the method:
import static us.abstracta.jmeter.javadsl.JmeterDsl.*;

import java.io.IOException;
import org.junit.jupiter.api.Test;

public class PerformanceTest {

  @Test
  public void testPerformance() throws IOException {
    testPlan(
        threadGroup(2, 10,
            httpSampler("http://my.service")
        )
    ).showInGui();
  }

}
Which ends up opening a window like this one:
Reporting
Once you have a test plan you would usually want to be able to analyze the collected information. This section contains several ways to achieve this.
Log requests and responses
The main mechanism provided by JMeter (and jmeter-java-dsl) to get information about generated requests, responses, and associated metrics is through the generation of JTL files.
This can be easily achieved in jmeter-java-dsl by using provided jtlWriter like in this example:
import static org.assertj.core.api.Assertions.assertThat;
import static us.abstracta.jmeter.javadsl.JmeterDsl.*;

import java.io.IOException;
import java.time.Duration;
import java.time.Instant;
import org.junit.jupiter.api.Test;
import us.abstracta.jmeter.javadsl.core.TestPlanStats;

public class PerformanceTest {

  @Test
  public void testPerformance() throws IOException {
    TestPlanStats stats = testPlan(
        threadGroup(2, 10,
            httpSampler("http://my.service")
        ),
        jtlWriter("target/jtls")
    ).run();
    assertThat(stats.overall().sampleTimePercentile99()).isLessThan(Duration.ofSeconds(5));
  }

}
TIP
By default, jtlWriter will write the most used information to evaluate the performance of the tested service. If you want to trace all the information of each request you may use jtlWriter with withAllFields() option. Doing this will provide all the information at the cost of additional computation and resource usage (fewer resources for actual load testing). You can tune which fields to include or not with jtlWriter and only log what you need, check JtlWriter for more details.
TIP
By default, jtlWriter will log every sample result, but in some cases you might want to log additional info when a sample result fails. In such scenarios you can use two jtlWriter instances like in this example:
testPlan(
    threadGroup(2, 10,
        httpSampler("http://my.service")
    ),
    jtlWriter("target/jtls/success")
      .logOnly(SampleStatus.SUCCESS),
    jtlWriter("target/jtls/error")
      .logOnly(SampleStatus.ERROR)
      .withAllFields(true)
)
TIP
jtlWriter will automatically generate .jtl files applying this format: <yyyy-MM-dd HH-mm-ss> <UUID>.jtl.
If you need a specific file name, for example for later postprocessing logic (eg: using CI build ID), you can specify it by using jtlWriter(directory, fileName).
When specifying the file name, make sure to use unique names, otherwise, the JTL contents may be appended to previous existing jtl files.
An additional option, specially targeted towards logging sample responses, is responseFileSaver which automatically generates a file for each received response. Here is an example:
import static org.assertj.core.api.Assertions.assertThat;
import static us.abstracta.jmeter.javadsl.JmeterDsl.*;

import java.io.IOException;
import java.time.Duration;
import java.time.Instant;
import org.junit.jupiter.api.Test;
import us.abstracta.jmeter.javadsl.core.TestPlanStats;

public class PerformanceTest {

  @Test
  public void testPerformance() throws IOException {
    TestPlanStats stats = testPlan(
        threadGroup(2, 10,
            httpSampler("http://my.service")
        ),
        responseFileSaver(Instant.now().toString().replace(":", "-") + "-response")
    ).run();
    assertThat(stats.overall().sampleTimePercentile99()).isLessThan(Duration.ofSeconds(5));
  }

}
Check ResponseFileSaver for more details.
Finally, if you have more specific needs that are not covered by previous examples, you can use jsr223PostProcessor to define your own custom logic like this:
import static org.assertj.core.api.Assertions.assertThat;
import static us.abstracta.jmeter.javadsl.JmeterDsl.*;

import java.io.IOException;
import java.time.Duration;
import java.time.Instant;
import org.junit.jupiter.api.Test;
import us.abstracta.jmeter.javadsl.core.TestPlanStats;

public class PerformanceTest {

  @Test
  public void testPerformance() throws IOException {
    TestPlanStats stats = testPlan(
        threadGroup(2, 10,
            httpSampler("http://my.service")
                .children(jsr223PostProcessor(
                    "new File('traceFile') << \"${prev.sampleLabel}>>${prev.responseDataAsString}\\n\""))
        )
    ).run();
    assertThat(stats.overall().sampleTimePercentile99()).isLessThan(Duration.ofSeconds(5));
  }

}
Check DslJsr223PostProcessor for more details.
Real-time metrics visualization and historic data storage
When running tests with JMeter (and in particular with jmeter-java-dsl) a usual requirement is to be able to store such test runs in a persistent database to, later on, review such metrics, and compare different test runs. Additionally, jmeter-java-dsl only provides some summary data of a test run in the console while it is running, but, since it doesn't provide any sort of UI, this doesn't allow you to easily analyze such information as it can be done in JMeter GUI.
InfluxDB
To overcome these limitations you can use provided support for publishing JMeter test run metrics to InfluxDB or Elasticsearch, which allows keeping a record of all run statistics and, through Grafana, get some nice dashboards like the following one:
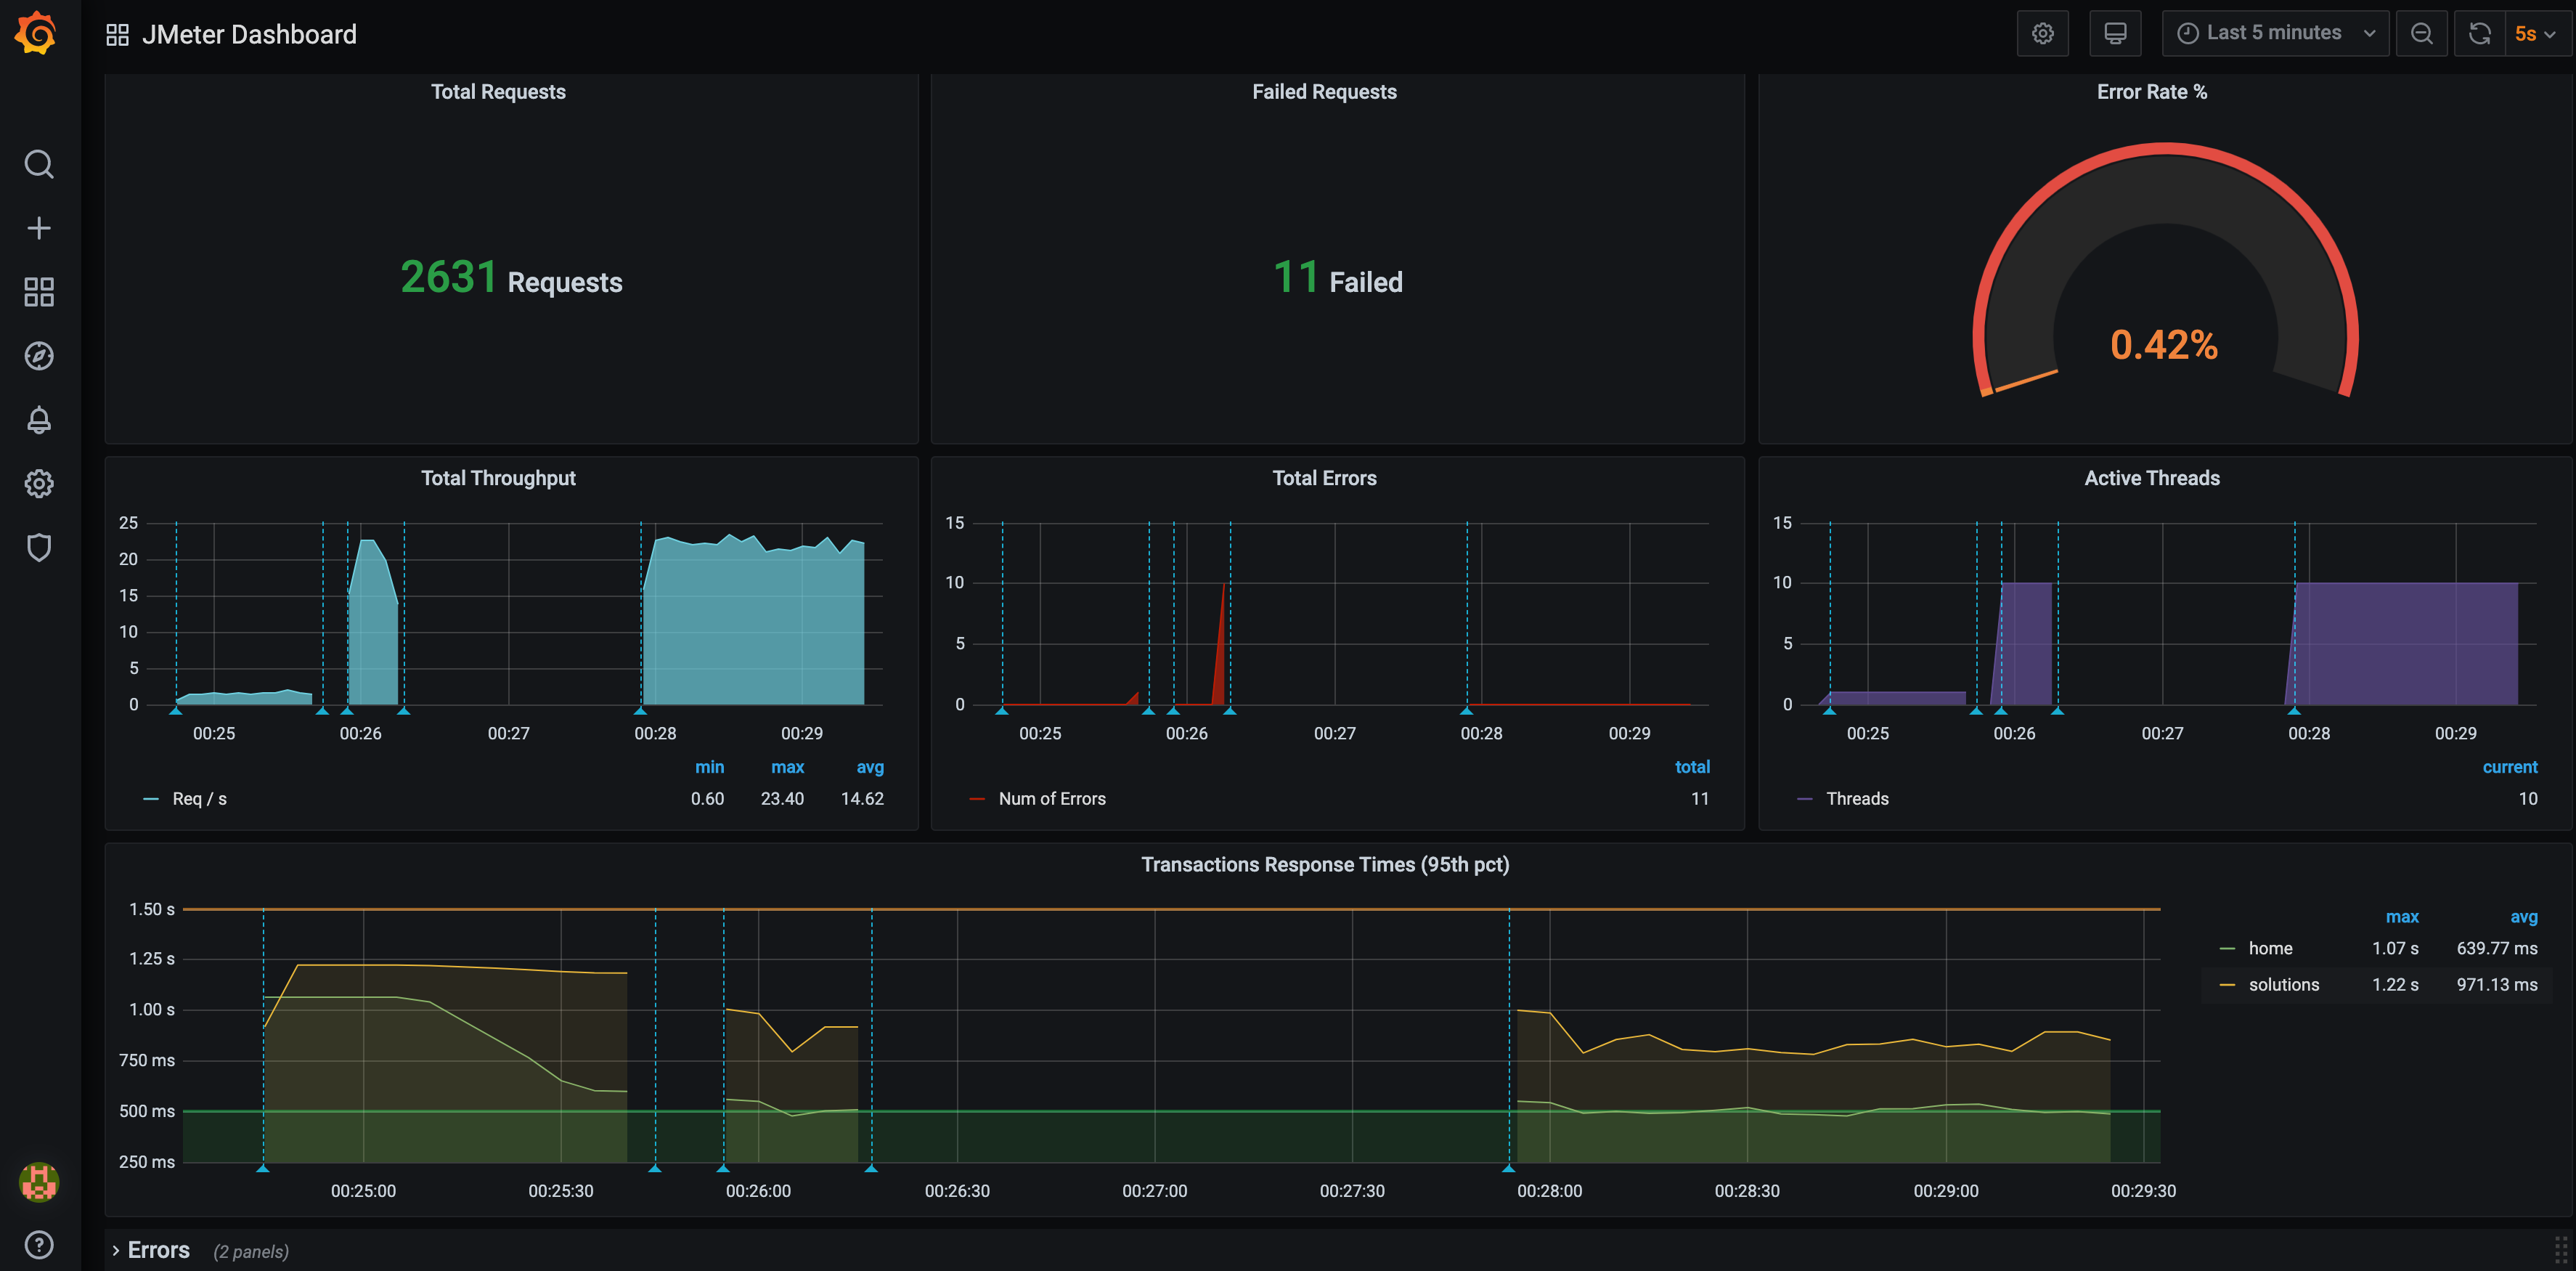
This can be easily done using influxDbListener, an existing InfluxDB & Grafana server, and using a dashboard like this one.
Here is an example test plan:
import static org.assertj.core.api.Assertions.assertThat;
import static us.abstracta.jmeter.javadsl.JmeterDsl.*;

import java.io.IOException;
import java.time.Duration;
import org.junit.jupiter.api.Test;
import us.abstracta.jmeter.javadsl.core.TestPlanStats;

public class PerformanceTest {

  @Test
  public void testPerformance() throws IOException {
    TestPlanStats stats = testPlan(
        threadGroup(2, 10,
            httpSampler("http://my.service")
        ),
        influxDbListener("http://localhost:8086/write?db=jmeter")
    ).run();
    assertThat(stats.overall().sampleTimePercentile99()).isLessThan(Duration.ofSeconds(5));
  }

}
If you want to try it locally, you can run docker-compose up (previously installing Docker in your machine) inside this directory. After containers are started, you can open Grafana at http://localhost:3000. Finally, run a performance test using the influxDbListener and you will be able to see the live results, and keep historic data. Cool, isn't it?!
WARNING
Use the provided docker-compose settings for local tests only. It uses weak credentials and is not properly configured for production purposes.
Check InfluxDbBackendListener for additional details and settings.
Graphite
In a similar fashion to InfluxDB, you can use Graphite and Grafana. Here is an example test plan using the graphiteListener:
import static org.assertj.core.api.Assertions.assertThat;
import static us.abstracta.jmeter.javadsl.JmeterDsl.*;

import java.io.IOException;
import java.time.Duration;
import org.junit.jupiter.api.Test;
import us.abstracta.jmeter.javadsl.core.TestPlanStats;

public class PerformanceTest {

  @Test
  public void testPerformance() throws IOException {
    TestPlanStats stats = testPlan(
        threadGroup(2, 10,
            httpSampler("http://my.service")
        ),
        graphiteListener("localhost:2004")
    ).run();
    assertThat(stats.overall().sampleTimePercentile99()).isLessThan(Duration.ofSeconds(5));
  }

}
As in the InfluxDB scenario, you can try it locally by running docker-compose up (previously installing Docker in your machine) inside this directory. After containers are started, you can follow the same steps as in the InfluxDB scenario.
WARNING
Use the provided docker-compose settings for local tests only. It uses weak credentials and is not properly configured for production purposes.
WARNING
graphiteListener is configured to use Pickle Protocol, and port 2004, by default. This is more efficient than text plain protocol, which is the one used by default by JMeter.
Elasticsearch
Another alternative is using provided jmeter-java-dsl-elasticsearch-listener module with Elasticsearch and Grafana servers using a dashboard like this one.
To use the module, you will need to include the following dependency in your project:
<dependency>
  <groupId>us.abstracta.jmeter</groupId>
  <artifactId>jmeter-java-dsl-elasticsearch-listener</artifactId>
  <version>2.2</version>
  <scope>test</scope>
</dependency>
repositories {
    ...
    maven { url 'https://jitpack.io' }
}

dependencies {
    ...
    testImplementation 'us.abstracta.jmeter:jmeter-java-dsl-elasticsearch-listener:2.2'
}
And use provided elasticsearchListener() method like in this example:
import static org.assertj.core.api.Assertions.assertThat;
import static us.abstracta.jmeter.javadsl.JmeterDsl.*;
import static us.abstracta.jmeter.javadsl.elasticsearch.listener.ElasticsearchBackendListener.*;

import java.io.IOException;
import java.time.Duration;
import org.junit.jupiter.api.Test;
import us.abstracta.jmeter.javadsl.core.TestPlanStats;

public class PerformanceTest {

  @Test
  public void testPerformance() throws IOException {
    TestPlanStats stats = testPlan(
        threadGroup(2, 10,
            httpSampler("http://my.service")
        ),
        elasticsearchListener("http://localhost:9200/jmeter")
    ).run();
    assertThat(stats.overall().sampleTimePercentile99()).isLessThan(Duration.ofSeconds(5));
  }

}
WARNING
This module uses this JMeter plugin which, at its current version, has performance and dependency issues that might affect your project. This and this pull requests fix those issues, but until they are merged and released, you might face such issues.
In the same fashion as InfluxDB, if you want to try it locally, you can run docker-compose up inside this directory and follow similar steps as described for InfluxDB to visualize live metrics in Grafana.
WARNING
Use provided docker-compose settings for local tests only. It uses weak or no credentials and is not properly configured for production purposes.
Check ElasticsearchBackendListener for additional details and settings.
Prometheus
As in previous scenarios, you can also use Prometheus and Grafana.
To use the module, you will need to include the following dependency in your project:
<dependency>
  <groupId>us.abstracta.jmeter</groupId>
  <artifactId>jmeter-java-dsl-prometheus</artifactId>
  <version>2.2</version>
  <scope>test</scope>
</dependency>
testImplementation 'us.abstracta.jmeter:jmeter-java-dsl-prometheus:2.2'
And use provided prometheusListener() method like in this example:
import static org.assertj.core.api.Assertions.assertThat;
import static us.abstracta.jmeter.javadsl.JmeterDsl.*;
import static us.abstracta.jmeter.javadsl.prometheus.DslPrometheusListener.*;

import java.io.IOException;
import java.time.Duration;
import org.junit.jupiter.api.Test;
import us.abstracta.jmeter.javadsl.core.TestPlanStats;

public class PerformanceTest {

  @Test
  public void testPerformance() throws IOException {
    TestPlanStats stats = testPlan(
        threadGroup(2, 10,
            httpSampler("http://my.service")
        ),
        prometheusListener()
    ).run();
    assertThat(stats.overall().sampleTimePercentile99()).isLessThan(Duration.ofSeconds(5));
  }

}
As in previous cases, you can to try it locally by running docker-compose up inside this directory. After containers are started, you can follow the same steps as in previous scenarios.
WARNING
Use the provided docker-compose settings for local tests only. It uses weak credentials and is not properly configured for production purposes.
Check DslPrometheusListener for details on listener settings.
Here is an example that shows the default settings used by prometheusListener:
import us.abstracta.jmeter.javadsl.prometheus.DslPrometheusListener.PrometheusMetric;
...
prometheusListener()
  .metrics(
    PrometheusMetric.responseTime("ResponseTime", "the response time of samplers")
      .labels(PrometheusMetric.SAMPLE_LABEL, PrometheusMetric.RESPONSE_CODE)
      .quantile(0.75, 0.5)
      .quantile(0.95, 0.1)
      .quantile(0.99, 0.01)
      .maxAge(Duration.ofMinutes(1)),
    PrometheusMetric.successRatio("Ratio", "the success ratio of samplers")
      .labels(PrometheusMetric.SAMPLE_LABEL, PrometheusMetric.RESPONSE_CODE)
  )
  .port(9270)
  .host("0.0.0.0")
  .endWait(Duration.ofSeconds(10))
...
Note that the default settings are different from the used JMeter Prometheus Plugin, to allow easier usage and avoid missing metrics at the end of test plan execution.
TIP
When configuring the prometheusListener always consider setting a endWait that is greater thant the Prometheus Server configured scrape_interval to avoid missing metrics at the end of test plan execution (e.g.: 2x the scrape interval value).
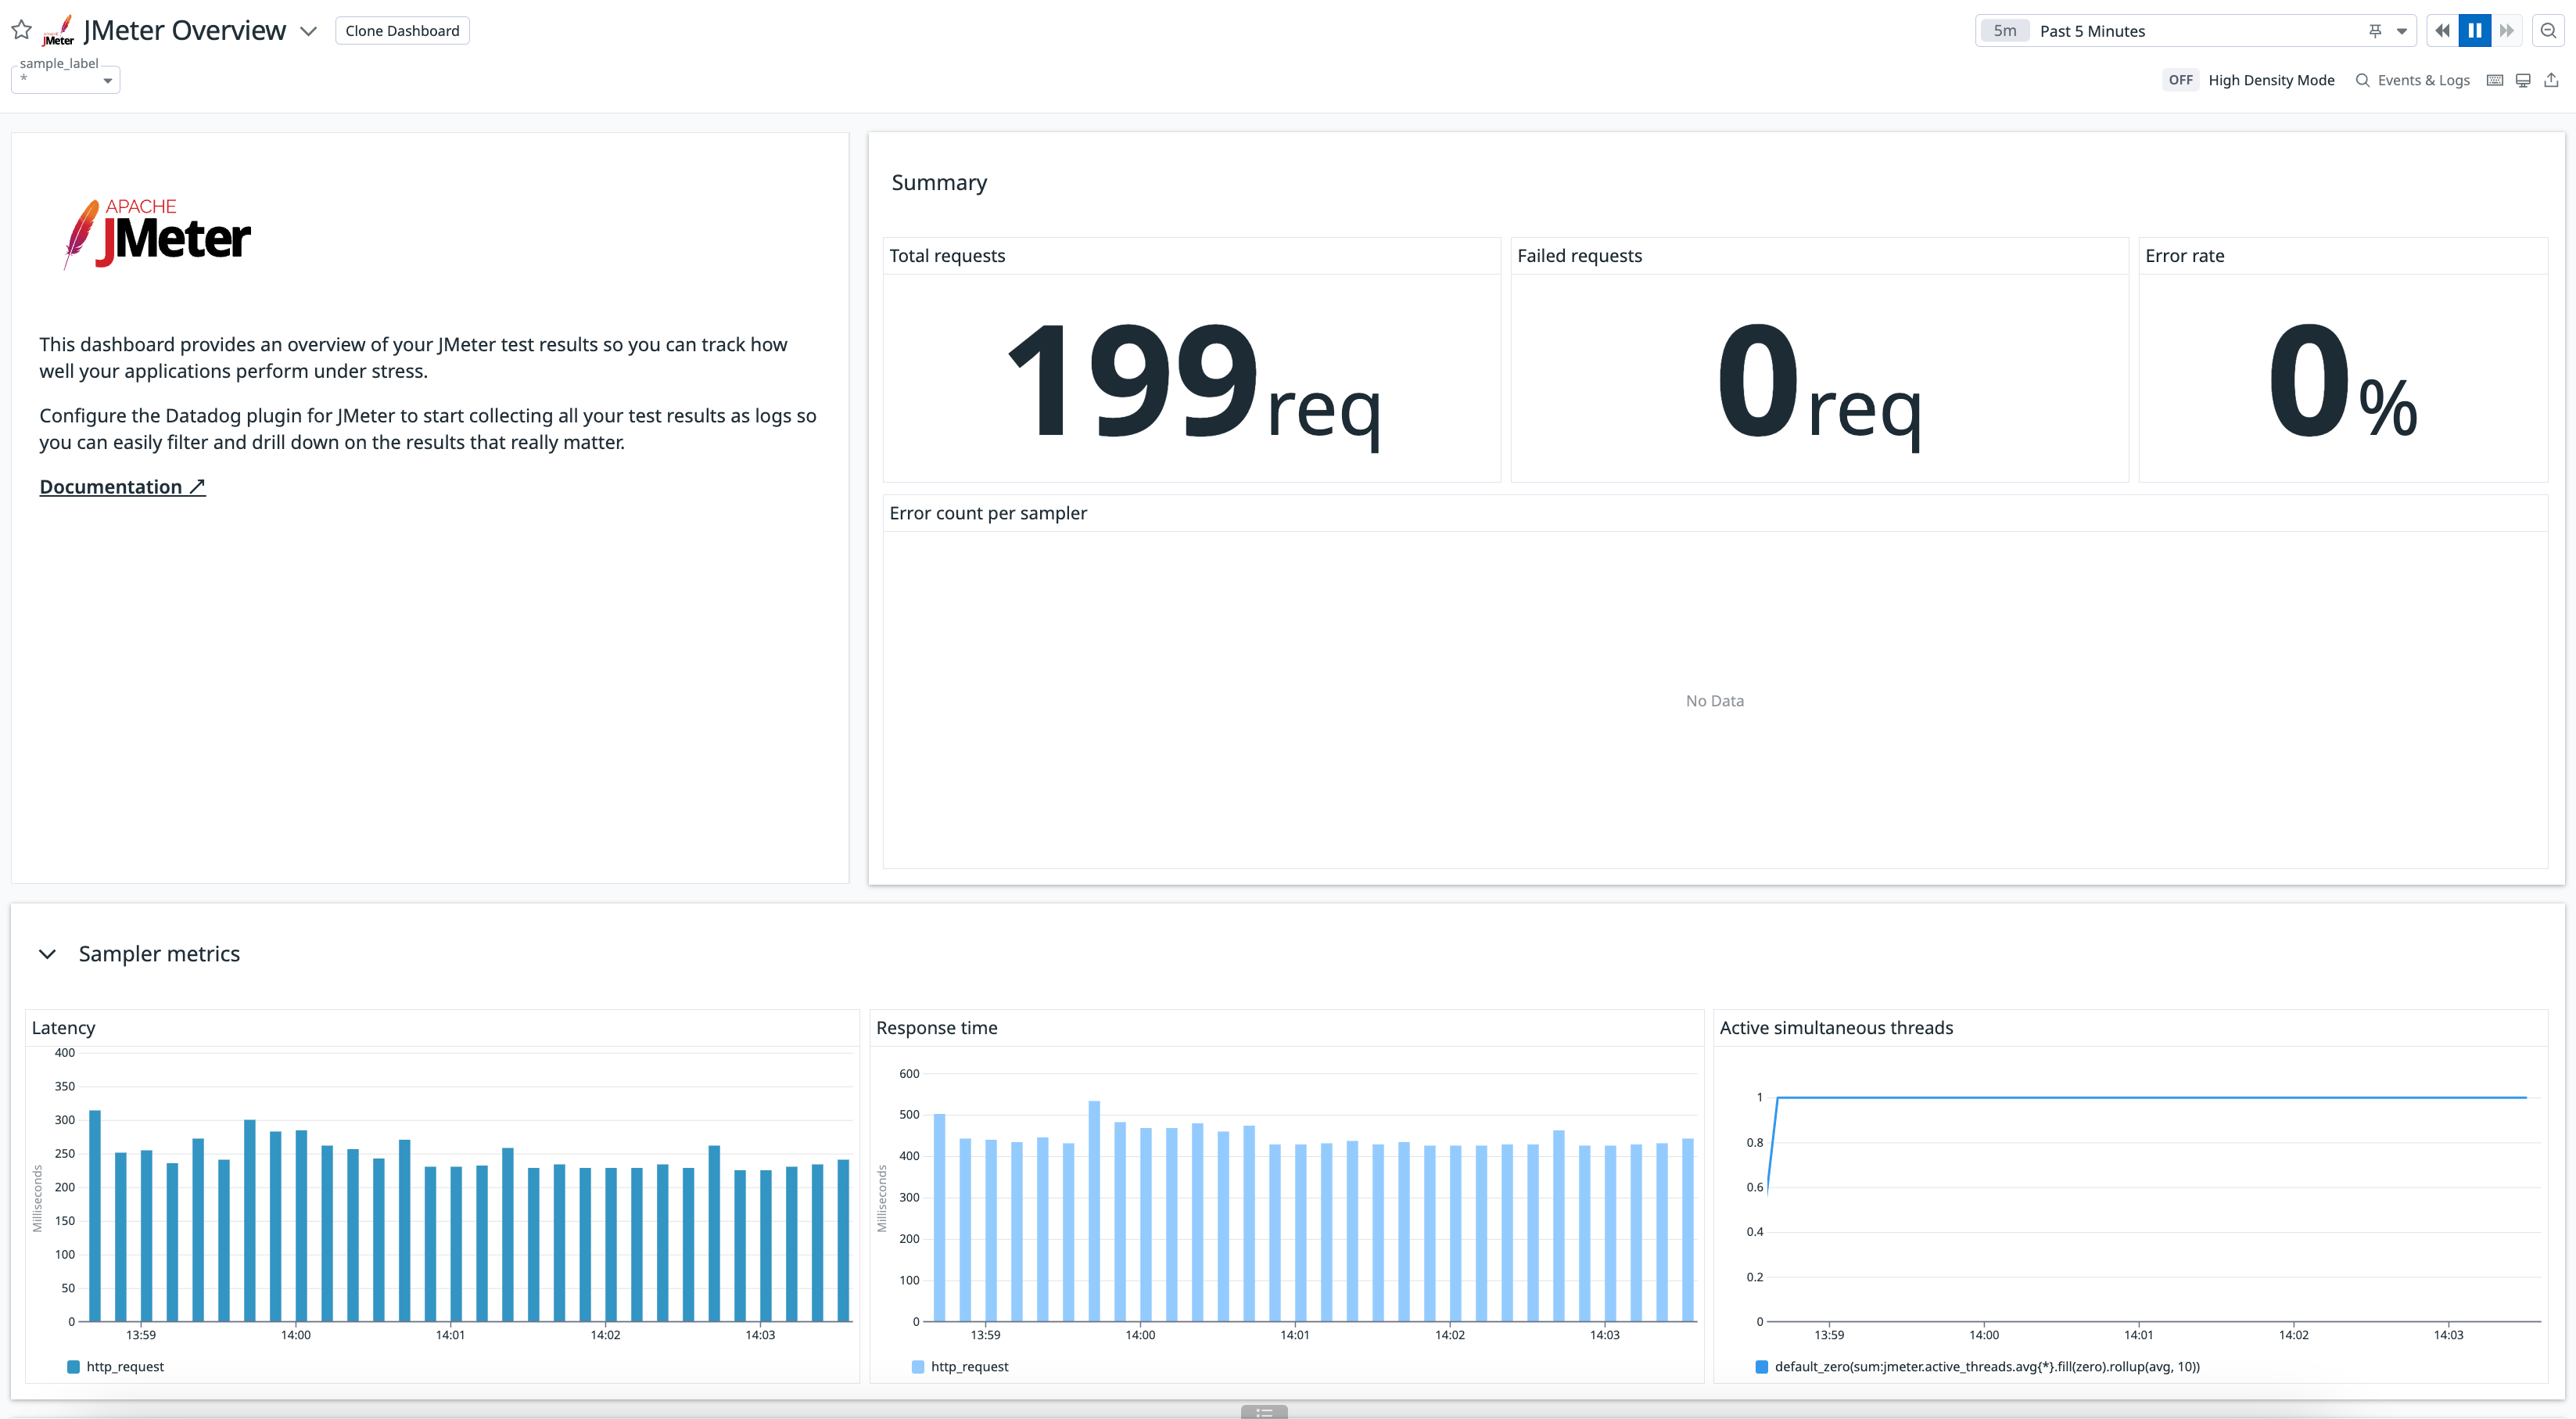
DataDog
Another option is using jmeter-java-dsl-datadog module which uses existing jmeter-datadog-backend-listener plugin to upload metrics to datadog which you can easily visualize and analize with DataDog provided JMeter dashboard. Here is an example of what you get:
To use the module, just include the dependency:
<dependency>
  <groupId>us.abstracta.jmeter</groupId>
  <artifactId>jmeter-java-dsl-datadog</artifactId>
  <version>2.2</version>
  <scope>test</scope>
</dependency>
repositories {
    ...
    maven { url 'https://jitpack.io' }
}

dependencies {
    ...
    testImplementation 'us.abstracta.jmeter:jmeter-java-dsl-datadog:2.2'
}
And use provided datadogListener() method like in this example:
import static org.assertj.core.api.Assertions.assertThat;
import static us.abstracta.jmeter.javadsl.JmeterDsl.*;
import static us.abstracta.jmeter.javadsl.datadog.DatadogBackendListener.*;

import java.io.IOException;
import java.time.Duration;
import org.junit.jupiter.api.Test;
import us.abstracta.jmeter.javadsl.core.TestPlanStats;

public class PerformanceTest {

  @Test
  public void testPerformance() throws IOException {
    TestPlanStats stats = testPlan(
        threadGroup(2, 10,
            httpSampler("http://my.service")
        ),
        datadogBackendListener(System.getenv("DATADOG_APIKEY"))
    ).run();
    assertThat(stats.overall().sampleTimePercentile99()).isLessThan(Duration.ofSeconds(5));
  }

}
TIP
If you use a DataDog instance in a site different than US1 (the default one), you can use .site(DatadogSite) method to select the proper site.
TIP
You can use .resultsLogs(true) to send results samples as logs to DataDog to get more information in DataDog on each sample of the test plan (for example for tracing). Enabling this property requires additional network traffic, that may affect test plan execution, and costs on DataDog, so use it sparingly.
TIP
You can use .tags() to add additional information to metrics sent to DataDog. Check DataDog documentation for more details.
Generate HTML reports from test plan execution
After running a test plan you would usually like to visualize the results in a friendly way that eases the analysis of collected information.
One, and preferred way, to do that is through previously mentioned alternatives.
Another way might just be using previously introduced jtlWriter and then loading the jtl file in JMeter GUI with one of JMeter provided listeners (like view results tree, summary report, etc.).
Another alternative is generating a standalone report for the test plan execution using jmeter-java-dsl provided htmlReporter like this:
import static org.assertj.core.api.Assertions.assertThat;
import static us.abstracta.jmeter.javadsl.JmeterDsl.*;

import java.io.IOException;
import java.time.Duration;
import java.time.Instant;
import org.junit.jupiter.api.Test;
import us.abstracta.jmeter.javadsl.core.TestPlanStats;

public class PerformanceTest {

  @Test
  public void testPerformance() throws IOException {
    TestPlanStats stats = testPlan(
        threadGroup(2, 10,
            httpSampler("http://my.service")
        ),
        htmlReporter("reports")
    ).run();
    assertThat(stats.overall().sampleTimePercentile99()).isLessThan(Duration.ofSeconds(5));
  }

}
WARNING
htmlReporter will create one directory for each generated report by applying the following template: <yyyy-MM-dd HH-mm-ss> <UUID>.
If you need a particular name for the report directory, for example for postprocessing logic (eg: adding CI build ID), you can use htmlReporter(reportsDirectory, name) to specify the name.
Make sure when specifying the name, for it to be unique, otherwise report generation will fail after test plan execution.
TIP
Time graphs by default group metrics per minute, but you can change this with provided timeGraphsGranularity method.
Live built-in graphs and stats
Sometimes you want to get live statistics on the test plan and don't want to install additional tools, and are not concerned about keeping historic data.
You can use dashboardVisualizer to get live charts and stats for quick review.
To use it, you need to add the following dependency:
<dependency>
  <groupId>us.abstracta.jmeter</groupId>
  <artifactId>jmeter-java-dsl-dashboard</artifactId>
  <version>2.2</version>
  <scope>test</scope>
</dependency>
testImplementation 'us.abstracta.jmeter:jmeter-java-dsl-dashboard:2.2'
And use it as you would with any of the previously mentioned listeners (like influxDbListener and jtlWriter).
Here is an example:
import static org.assertj.core.api.Assertions.assertThat;
import static us.abstracta.jmeter.javadsl.JmeterDsl.*;
import static us.abstracta.jmeter.javadsl.dashboard.DashboardVisualizer.*;

import java.io.IOException;
import java.time.Duration;
import org.junit.jupiter.api.Test;
import us.abstracta.jmeter.javadsl.core.TestPlanStats;

public class PerformanceTest {

  @Test
  public void testPerformance() throws IOException {
    TestPlanStats stats = testPlan(
        threadGroup("Group1")
            .rampToAndHold(10, Duration.ofSeconds(10), Duration.ofSeconds(10))
            .children(
                httpSampler("Sample 1", "http://my.service")
            ),
        threadGroup("Group2")
            .rampToAndHold(20, Duration.ofSeconds(10), Duration.ofSeconds(20))
            .children(
                httpSampler("Sample 2", "http://my.service/get")
            ),
        dashboardVisualizer()
    ).run();
    assertThat(stats.overall().sampleTimePercentile99()).isLessThan(Duration.ofSeconds(5));
  }

}
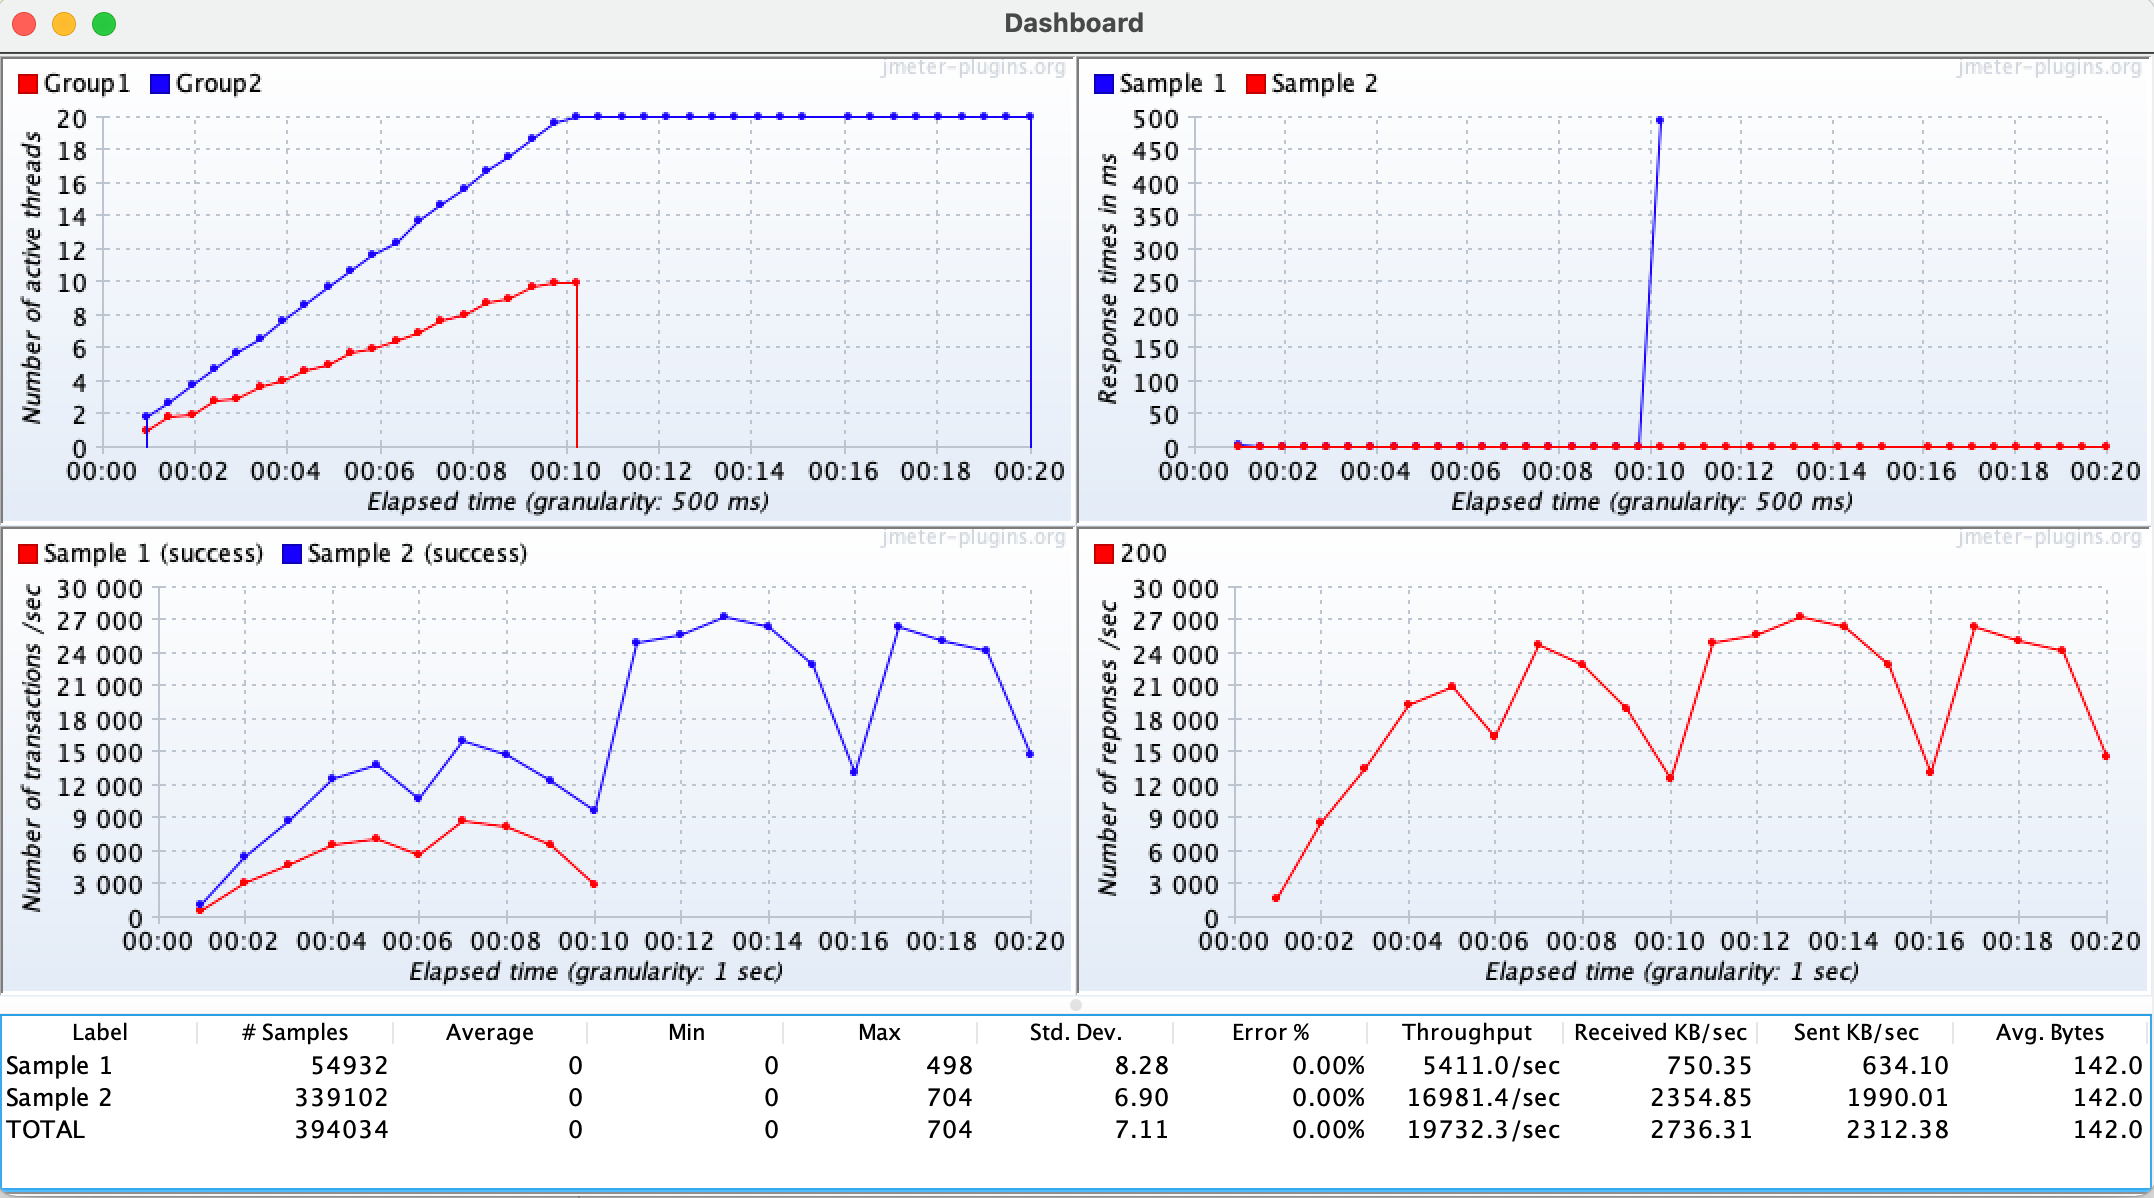
The dashboardVisualizer will pop up a window like the following one, which you can use to trace statistics while the test plan runs:
WARNING
The dashboard imposes additional resources (CPU & RAM) consumption on the machine generating the load test, which may affect the test plan execution and reduce the number of concurrent threads you may reach in your machine. In general, prefer using one of the previously mentioned methods and using the dashboard just for local testing and quick feedback.
Remember to remove it when is no longer needed in the test plan
WARNING
The test will not end until you close all popup windows. This allows you to see the final charts and statistics of the plan before ending the test.
TIP
As with jtlWriter and influxDbListener, you can place dashboardVisualizer at different levels of the test plan (at the test plan level, at the thread group level, as a child of a sampler, etc.), to only capture statistics of that particular part of the test plan.
Response processing
Check for expected response
By default, JMeter marks any HTTP request with a fail response code (4xx or 5xx) as failed, which allows you to easily identify when some request unexpectedly fails. But in many cases, this is not enough or desirable, and you need to check for the response body (or some other field) to contain (or not) a certain string.
This is usually accomplished in JMeter with the usage of Response Assertions, which provides an easy and fast way to verify that you get the proper response for each step of the test plan, marking the request as a failure when the specified condition is not met.
Here is an example of how to specify a response assertion in jmeter-java-dsl:
import static org.assertj.core.api.Assertions.assertThat;
import static us.abstracta.jmeter.javadsl.JmeterDsl.*;

import java.io.IOException;
import java.time.Duration;
import org.junit.jupiter.api.Test;
import us.abstracta.jmeter.javadsl.core.TestPlanStats;

public class PerformanceTest {

  @Test
  public void testPerformance() throws IOException {
    TestPlanStats stats = testPlan(
        threadGroup(2, 10,
            httpSampler("http://my.service")
                .children(
                    responseAssertion().containsSubstrings("OK")
                )
        )
    ).run();
    assertThat(stats.overall().sampleTimePercentile99()).isLessThan(Duration.ofSeconds(5));
  }

}
Check Response Assertion for more details and additional options.
For more complex scenarios check following section.
Check for expected JSON
When checking for JSON responses, it is usually easier to just use jsonAssertion. Here is an example:
import static org.assertj.core.api.Assertions.assertThat;
import static us.abstracta.jmeter.javadsl.JmeterDsl.*;

import java.io.IOException;
import java.time.Duration;
import org.apache.http.entity.ContentType;
import org.junit.jupiter.api.Test;
import us.abstracta.jmeter.javadsl.core.TestPlanStats;

public class PerformanceTest {

  @Test
  public void testPerformance() throws IOException {
    TestPlanStats stats = testPlan(
        threadGroup(2, 10,
            httpSampler("http://my.service/accounts")
                .post("{\"name\": \"John Doe\"}", ContentType.APPLICATION_JSON)
                .children(
                    jsonAssertion("id")
                ),
            httpSampler("http://my.service/accounts/${ACCOUNT_ID}")
        )
    ).run();
    assertThat(stats.overall().sampleTimePercentile99()).isLessThan(Duration.ofSeconds(5));
  }

}
TIP
Previous example just checks that sample result JSON contains an id field. You can use matches(regex), equalsTo(value) or even equalsToJson(json) methods to check id associated value. Additionally, you can use the not() method to check for the inverse condition. E.g.: does not contain id field, or field value does not match a given regular expression or is not equal to a given value.
TIP
By default this element uses JMeter JSON JMESPath Assertion element, and in consequence, JMESPath as query language.
If you want to use JMeter JSON Assertion element, and in consequence JSONPath as the query language, you can simply use .queryLanguage(JsonQueryLanguage.JSON_PATH) and a JSONPath query.
Change sample result statuses with custom logic
Sometimes response assertions and JMeter default behavior are not enough, and custom logic is required. In such scenarios you can use jsr223PostProcessor as in this example where the 429 status code is not considered as a fail status code:
import static org.assertj.core.api.Assertions.assertThat;
import static us.abstracta.jmeter.javadsl.JmeterDsl.*;

import java.io.IOException;
import java.time.Duration;
import org.junit.jupiter.api.Test;
import us.abstracta.jmeter.javadsl.core.TestPlanStats;

public class PerformanceTest {

  @Test
  public void testPerformance() throws IOException {
    TestPlanStats stats = testPlan(
        threadGroup(2, 10,
            httpSampler("http://my.service")
                .children(
                    jsr223PostProcessor(
                        "if (prev.responseCode == '429') { prev.successful = true }")
                )
        )
    ).run();
    assertThat(stats.overall().sampleTimePercentile99()).isLessThan(Duration.ofSeconds(5));
  }

}
You can also use a Java lambda instead of providing Groovy script, which benefits from Java type safety & IDEs code auto-completion and consumes less CPU:
jsr223PostProcessor(s -> {
    if ("429".equals(s.prev.getResponseCode())) {
      s.prev.setSuccessful(true);
    }
})
WARNING
Even though using Java Lambdas has several benefits, they are also less portable. Check following section for more details.
Check DslJsr223PostProcessor for more details and additional options.
WARNING
JSR223PostProcessor is a very powerful tool but is not the only, nor the best, alternative for many cases where JMeter already provides a better and simpler alternative. For instance, the previous example might be implemented with previously presented Response Assertion.
Lambdas
As previously mentioned, using Java lambdas is in general more performant than using Groovy scripts (here are some comparisons) and are easier to develop and maintain due to type safety, IDE autocompletion, etc.
But, they are also less portable.
For instance, they will not work out of the box with remote engines (like BlazeMeterEngine) or while saving JMX and running it in standalone JMeter.
One option is using groovy scripts and __groovy function, but doing so, you lose the previously mentioned benefits.
Here is another approach to still benefit from Java code (vs Groovy script) and run in remote engines and standalone JMeter.
Lambdas in remote engine
Here are the steps to run test plans containing Java lambdas in BlazeMeterEngine:
Replace all Java lambdas with public static classes implementing proper script interface.
For example, if you have the following test:
public class PerformanceTest {

  @Test
  public void testPerformance() throws Exception {
    testPlan(
        threadGroup(2, 10,
            httpSampler("http://my.service")
                .children(
                    jsr223PostProcessor(s -> {
                      if ("429".equals(s.prev.getResponseCode())) {
                        s.prev.setSuccessful(true);
                      }
                    })
                )
        )
    ).runIn(new BlazeMeterEngine(System.getenv("BZ_TOKEN")));
  }

}
You can change it to:
public class PerformanceTest {

  public static class StatusSuccessProcessor implements PostProcessorScript {

    @Override
    public void runScript(PostProcessorVars s) {
      if ("429".equals(s.prev.getResponseCode())) {
        s.prev.setSuccessful(true);
      }
    }

  }

  @Test
  public void testPerformance() throws Exception {
    testPlan(
        threadGroup(2, 10,
            httpSampler("http://my.service")
                .children(
                    jsr223PostProcessor(StatusSuccessProcessor.class)
                )
        )
    ).runIn(new BlazeMeterEngine(System.getenv("BZ_TOKEN")));
  }

}
Script interface to implement, depends on where you use the lambda code. Available interfaces are
PropertyScript,PreProcessorScript,PostProcessorScript, andSamplerScript.Upload your test code and dependencies to BlazeMeter.
If you use maven, here is what you can add to your project to configure this:
<plugins>
  ...
  <!-- this generates a jar containing your test code (including the public static class previously mentioned) -->
  <plugin>
     <groupId>org.apache.maven.plugins</groupId>
     <artifactId>maven-jar-plugin</artifactId>
     <version>3.3.0</version>
     <executions>
       <execution>
         <goals>
           <goal>test-jar</goal>
         </goals>
       </execution>
     </executions>
  </plugin>
  <!-- this copies project dependencies to target/libs directory -->
  <plugin>
    <groupId>org.apache.maven.plugins</groupId>
    <artifactId>maven-dependency-plugin</artifactId>
    <version>3.6.0</version>
    <executions>
      <execution>
        <id>copy-dependencies</id>
        <phase>package</phase>
        <goals>
          <goal>copy-dependencies</goal>
        </goals>
        <configuration>
          <outputDirectory>${project.build.directory}/libs</outputDirectory>
          <!-- include here, separating by commas, any additional dependencies (just the artifacts ids) you need to upload to BlazeMeter -->
          <!-- AzureEngine automatically uploads JMeter dsl artifacts, so only transitive or custom dependencies would be required -->
          <!-- if you would like for BlazeMeterEngine and OctoPerfEngine to automatically upload JMeter DSL artifacts, please create an issue in GitHub repository -->
          <includeArtifactIds>jmeter-java-dsl</includeArtifactIds>
        </configuration>
      </execution>
    </executions>
  </plugin>
  <!-- this takes care of executing tests classes ending with IT after test jar is generated and dependencies are copied -->
  <!-- additionally, it sets some system properties as to easily identify test jar file -->
  <plugin>
    <groupId>org.apache.maven.plugins</groupId>
    <artifactId>maven-failsafe-plugin</artifactId>
    <version>3.0.0-M7</version>
    <configuration>
      <systemPropertyVariables>
        <testJar.path>${project.build.directory}/${project.artifactId}-${project.version}-tests.jar</testJar.path>
      </systemPropertyVariables>
    </configuration>
    <executions>
      <execution>
        <goals>
          <goal>integration-test</goal>
          <goal>verify</goal>
        </goals>
      </execution>
    </executions>
  </plugin>
</plugins>
Additionally, rename your test class to use IT suffix (so it runs after test jar is created and dependencies are copied), and add to
BlazeMeterEnginelogic to upload the jars. For example:// Here we renamed from PerformanceTest to PerformanceIT public class PerformanceIT { ... @Test public void testPerformance() throws Exception { testPlan( ... ).runIn(new BlazeMeterEngine(System.getenv("BZ_TOKEN")) .assets(findAssets())); } private File[] findAssets() { File[] libsFiles = new File("target/libs").listFiles(); File[] ret = new File[libsFiles.length + 1]; ret[0] = new File(System.getProperty("testJar.path")); System.arraycopy(libsFiles, 0, ret, 1, libsFiles.length); return ret; } }TIP
Currently only
BlazeMeterEngineandAzureEngineprovide a way to upload assets. If you need support for other engines, please request it in an issue.Execute your tests with maven (either with
mvn clean verifyor as part ofmvn clean install) or IDE (by first packaging your project, and then executingPerformanceITtest).
Lambdas in standalone JMeter
If you save your test plan with the saveAsJmx() test plan method and then want to execute the test plan in JMeter, you will need to:
Replace all Java lambdas with public static classes implementing proper script interface.
Same as the previous section.
Package your test code in a jar.
Same as the previous section.
Copy all dependencies, in addition to
jmeter-java-dsl, required by the lambda code to JMeterlib/extfolder.You can also use
maven-dependency-pluginand runmvn package -DskipTeststo get the actual jars. If the test plan requires any particular jmeter plugin, then you would need to copy those as well.
Use part of a response in a subsequent request (aka correlation)
It is a usual requirement while creating a test plan for an application to be able to use part of a response (e.g.: a generated ID, token, etc.) in a subsequent request. This can be easily achieved using JMeter extractors and variables.
Regular expressions extraction
Here is an example with jmeter-java-dsl using regular expressions:
import static org.assertj.core.api.Assertions.assertThat;
import static us.abstracta.jmeter.javadsl.JmeterDsl.*;

import java.io.IOException;
import java.time.Duration;
import org.apache.http.entity.ContentType;
import org.junit.jupiter.api.Test;
import us.abstracta.jmeter.javadsl.core.TestPlanStats;

public class PerformanceTest {

  @Test
  public void testPerformance() throws IOException {
    TestPlanStats stats = testPlan(
        threadGroup(2, 10,
            httpSampler("http://my.service/accounts")
                .post("{\"name\": \"John Doe\"}", ContentType.APPLICATION_JSON)
                .children(
                    regexExtractor("ACCOUNT_ID", "\"id\":\"([^\"]+)\"")
                ),
            httpSampler("http://my.service/accounts/${ACCOUNT_ID}")
        )
    ).run();
    assertThat(stats.overall().sampleTimePercentile99()).isLessThan(Duration.ofSeconds(5));
  }

}
Check DslRegexExtractor for more details and additional options.
Boundaries based extraction
Regular expressions are quite powerful and flexible, but also are complex and performance might not be optimal in some scenarios. When you know that desired extraction is always surrounded by some specific text that never varies, then you can use boundaryExtractor which is simpler and in many cases more performant:
import static org.assertj.core.api.Assertions.assertThat;
import static us.abstracta.jmeter.javadsl.JmeterDsl.*;

import java.io.IOException;
import java.time.Duration;
import org.apache.http.entity.ContentType;
import org.junit.jupiter.api.Test;
import us.abstracta.jmeter.javadsl.core.TestPlanStats;

public class PerformanceTest {

  @Test
  public void testPerformance() throws IOException {
    TestPlanStats stats = testPlan(
        threadGroup(2, 10,
            httpSampler("http://my.service/accounts")
                .post("{\"name\": \"John Doe\"}", ContentType.APPLICATION_JSON)
                .children(
                    boundaryExtractor("ACCOUNT_ID", "\"id\":\"", "\"")
                ),
            httpSampler("http://my.service/accounts/${ACCOUNT_ID}")
        )
    ).run();
    assertThat(stats.overall().sampleTimePercentile99()).isLessThan(Duration.ofSeconds(5));
  }

}
Check DslBoundaryExtractor for more details and additional options.
JSON extraction
When the response of a request is JSON, then you can use jsonExtractor like in the following example:
import static org.assertj.core.api.Assertions.assertThat;
import static us.abstracta.jmeter.javadsl.JmeterDsl.*;

import java.io.IOException;
import java.time.Duration;
import org.apache.http.entity.ContentType;
import org.junit.jupiter.api.Test;
import us.abstracta.jmeter.javadsl.core.TestPlanStats;

public class PerformanceTest {

  @Test
  public void testPerformance() throws IOException {
    TestPlanStats stats = testPlan(
        threadGroup(2, 10,
            httpSampler("http://my.service/accounts")
                .post("{\"name\": \"John Doe\"}", ContentType.APPLICATION_JSON)
                .children(
                    jsonExtractor("ACCOUNT_ID", "id")
                ),
            httpSampler("http://my.service/accounts/${ACCOUNT_ID}")
        )
    ).run();
    assertThat(stats.overall().sampleTimePercentile99()).isLessThan(Duration.ofSeconds(5));
  }

}
TIP
By default this element uses JMeter JSON JMESPath Extractor element, and in consequence JMESPath as query language.
If you want to use JMeter JSON Extractor element, and in consequence JSONPath as query language, you can simply use .queryLanguage(JsonQueryLanguage.JSON_PATH) and a JSONPath query.
Requests generation
Conditionals
At some point, you will need to execute part of a test plan according to a certain condition (eg: a value extracted from a previous request). When you reach that point, you can use ifController like in the following example:
import static org.assertj.core.api.Assertions.assertThat;
import static us.abstracta.jmeter.javadsl.JmeterDsl.*;

import java.io.IOException;
import java.time.Duration;
import org.apache.http.entity.ContentType;
import org.junit.jupiter.api.Test;
import us.abstracta.jmeter.javadsl.core.TestPlanStats;

public class PerformanceTest {

  @Test
  public void testPerformance() throws IOException {
    TestPlanStats stats = testPlan(
        threadGroup(2, 10,
            httpSampler("http://my.service/accounts")
                .post("{\"name\": \"John Doe\"}", ContentType.APPLICATION_JSON)
                .children(
                    regexExtractor("ACCOUNT_ID", "\"id\":\"([^\"]+)\"")
                ),
            ifController("${__groovy(vars['ACCOUNT_ID'] != null)}",
                httpSampler("http://my.service/accounts/${ACCOUNT_ID}")
            )
        )
    ).run();
    assertThat(stats.overall().sampleTimePercentile99()).isLessThan(Duration.ofSeconds(5));
  }

}
You can also use a Java lambda instead of providing JMeter expression, which benefits from Java type safety & IDEs code auto-completion and consumes less CPU:
ifController(s -> s.vars.get("ACCOUNT_ID") != null,
    httpSampler("http://my.service/accounts/${ACCOUNT_ID}")
)
WARNING
Even though using Java Lambdas has several benefits, they are also less portable. Check this section for more details.
Check DslIfController and JMeter Component documentation for more details.
Loops
Iterating over extracted values
A common use case is to iterate over a list of values extracted from a previous request and execute part of the plan for each extracted value. This can be easily done using foreachController like in the following example:
package us.abstracta.jmeter.javadsl;

import static org.assertj.core.api.Assertions.assertThat;
import static us.abstracta.jmeter.javadsl.JmeterDsl.*;

import java.io.IOException;
import java.time.Duration;
import org.junit.jupiter.api.Test;
import us.abstracta.jmeter.javadsl.core.TestPlanStats;

public class PerformanceTest {

  @Test
  public void testPerformance() throws IOException {
    String productsIdVarName = "PRODUCT_IDS";
    String productIdVarName = "PRODUCT_ID";
    String productsPath = "/products";
    TestPlanStats stats = testPlan(
        httpDefaults().url("http://my.service"),
        threadGroup(2, 10,
            httpSampler(productsPath)
                .children(
                    jsonExtractor(productsIdVarName, "[].id")
                        .matchNumber(-1)
                ),
            forEachController(productsIdVarName, productIdVarName,
                httpSampler(productsPath + "/${" + productIdVarName + "}")
            )
        )
    ).run();
    assertThat(stats.overall().sampleTimePercentile99()).isLessThan(Duration.ofSeconds(5));
  }

}
TIP
JMeter automatically generates a variable __jm__<loopName>__idx with the current index of the for each iteration (starting with 0), which you can use in controller children elements if needed. The default name for the for each controller, when not specified, is foreach.
Check DslForEachController for more details.
Iterating while a condition is met
If at any time you want to execute a given part of a test plan, inside a thread iteration, while a condition is met, then you can use whileController (internally using JMeter While Controller) like in the following example:
import static org.assertj.core.api.Assertions.assertThat;
import static us.abstracta.jmeter.javadsl.JmeterDsl.*;

import java.io.IOException;
import java.time.Duration;
import org.apache.http.entity.ContentType;
import org.junit.jupiter.api.Test;
import us.abstracta.jmeter.javadsl.core.TestPlanStats;

public class PerformanceTest {

  @Test
  public void testPerformance() throws IOException {
    TestPlanStats stats = testPlan(
        threadGroup(2, 10,
            whileController("${__groovy(vars['ACCOUNT_ID'] == null)}",
                httpSampler("http://my.service/accounts")
                    .post("{\"name\": \"John Doe\"}", ContentType.APPLICATION_JSON)
                    .children(
                        regexExtractor("ACCOUNT_ID", "\"id\":\"([^\"]+)\"")
                    )
            )
        )
    ).run();
    assertThat(stats.overall().sampleTimePercentile99()).isLessThan(Duration.ofSeconds(5));
  }

}
As with ifController, you can also use Java lambdas to benefit from IDE auto-completion and type safety and less CPU consumption. Eg:
whileController(s -> s.vars.get("ACCOUNT_ID") == null,
    httpSampler("http://my.service/accounts")
      .post("{\"name\": \"John Doe\"}", Type.APPLICATION_JSON)
      .children(
        regexExtractor("ACCOUNT_ID", "\"id\":\"([^\"]+)\"")
      )
)
WARNING
Even though using Java Lambdas has several benefits, they are also less portable. Check this section for more details.
WARNING
JMeter evaluates while conditions before entering each iteration, and after exiting each iteration. Take this into consideration if the condition has side effects (eg: incrementing counters, altering some other state, etc).
TIP
JMeter automatically generates a variable __jm__<loopName>__idx with the current index of while iteration (starting with 0). Example:
whileController("items", "${__groovy(vars.getObject('__jm__items__idx') < 4)}",
    httpSampler("http://my.service/items")
      .post("{\"name\": \"My Item\"}", Type.APPLICATION_JSON)
)
The default name for the while controller, when not specified, is while.
Check DslWhileController for more details.
Iterating a fixed number of times
In simple scenarios where you just want to execute a fixed number of times, within a thread group iteration, a given part of the test plan, you can just use forLoopController (which uses JMeter Loop Controller component) as in the following example:
import static org.assertj.core.api.Assertions.assertThat;
import static us.abstracta.jmeter.javadsl.JmeterDsl.*;

import java.io.IOException;
import java.time.Duration;
import org.junit.jupiter.api.Test;
import us.abstracta.jmeter.javadsl.core.TestPlanStats;

public class PerformanceTest {

  @Test
  public void testPerformance() throws IOException {
    TestPlanStats stats = testPlan(
        threadGroup(2, 10,
            forLoopController(5,
                httpSampler("http://my.service/accounts")
            )
        )
    ).run();
    assertThat(stats.overall().sampleTimePercentile99()).isLessThan(Duration.ofSeconds(5));
  }

}
This will result in 10 * 5 = 50 requests to the given URL for each thread in the thread group.
TIP
JMeter automatically generates a variable __jm__<loopName>__idx with the current index of for loop iteration (starting with 0) which you can use in children elements. The default name for the for loop controller, when not specified, is for.
Check ForLoopController for more details.
Iterating for a given period
In some scenarios you might want to execute a given logic until all the steps are executed or a given period of time has passed. In these scenarios you can use runtimeController which stops executing children elements when a specified time is reached.
Here is an example which makes requests to a page until token expires by using runtimeController in combination with whileController.
import static org.assertj.core.api.Assertions.assertThat;
import static us.abstracta.jmeter.javadsl.JmeterDsl.*;

import java.io.IOException;
import java.time.Duration;
import org.junit.jupiter.api.Test;
import us.abstracta.jmeter.javadsl.core.TestPlanStats;

public class PerformanceTest {

  @Test
  public void testPerformance() throws IOException {
    Duration tokenExpiration = Duration.ofSeconds(5);
    TestPlanStats stats = testPlan(
        threadGroup(2, 10,
            httpSampler("http://my.service/token"),
            runtimeController(tokenExpiration,
                whileController("true",
                    httpSampler("http://my.service/accounts")
                )
            )
        )
    ).run();
    assertThat(stats.overall().sampleTimePercentile99()).isLessThan(Duration.ofSeconds(5));
  }

}
Check DslRuntimeController for more details.
Execute only once in thread
In some cases, you only need to run part of a test plan once. For these need, you can use onceOnlyController. This controller will execute a part of the test plan only one time on the first iteration of each thread (using JMeter Once Only Controller Component).
You can use this, for example, for one-time authorization or for setting JMeter variables or properties.
Here is an example:
import static us.abstracta.jmeter.javadsl.JmeterDsl.*;

import org.apache.jmeter.protocol.http.util.HTTPConstants;
import org.junit.jupiter.api.Test;
import us.abstracta.jmeter.javadsl.JmeterDslTest;

public class DslOnceOnlyControllerTest extends JmeterDslTest {

  @Test
  public void shouldExecuteOnlyOneTimeWhenOnceOnlyControllerInPlan() throws Exception {
    testPlan(
        threadGroup(1, 10,
            onceOnlyController(
                httpSampler("http://my.service/login") // only runs once
                    .method(HTTPConstants.POST)
                    .header("Authorization", "Basic asdf=")
                    .children(
                        regexExtractor("AUTH_TOKEN", "authToken=(.*)")
                    )
            ),
            httpSampler("http://my.service/accounts") // runs ten times
                .header("Authorization", "Bearer ${AUTH_TOKEN}")
        )
    ).run();
  }

}
Check DslOnceOnlyController for more details.
Group requests
Sometimes, is necessary to be able to group requests which constitute different steps in a test. For example, to separate necessary requests to do a login from the ones used to add items to the cart and the ones to do a purchase. JMeter (and the DSL) provide Transaction Controllers for this purpose, here is an example:
import static us.abstracta.jmeter.javadsl.JmeterDsl.*;

import java.io.IOException;
import org.apache.http.entity.ContentType;
import org.junit.jupiter.api.Test;

public class PerformanceTest {

  @Test
  public void testTransactions() throws IOException {
    testPlan(
        threadGroup(2, 10,
            transaction('login',
                httpSampler("http://my.service"),
                httpSampler("http://my.service/login")
                    .post("user=test&password=test", ContentType.APPLICATION_FORM_URLENCODED)
            ),
            transaction('addItemToCart',
                httpSampler("http://my.service/items"),
                httpSampler("http://my.service/cart/items")
                    .post("{\"id\": 1}", ContentType.APPLICATION_JSON)
            )
        )
    ).run();
  }

}
This will provide additional sample results for each transaction, which contain the aggregate metrics for containing requests, allowing you to focus on the actual flow steps instead of each particular request.
If you don't want to generate additional sample results (and statistics), and want to group requests for example to apply a given timer, config, assertion, listener, pre- or post-processor, then you can use simpleController like in following example:
import static us.abstracta.jmeter.javadsl.JmeterDsl.*;

import java.io.IOException;
import org.apache.http.entity.ContentType;
import org.junit.jupiter.api.Test;

public class PerformanceTest {

  @Test
  public void testTransactions() throws IOException {
    testPlan(
        threadGroup(2, 10,
            simpleController('login',
                httpSampler("http://my.service"),
                httpSampler("http://my.service/users"),
                responseAssertion()
                  .containsSubstrings("OK")
            )
        )
    ).run();
  }

}
You can even use transactionController and simpleController to easily modularize parts of your test plan into Java methods (or classes) like in this example:
import static us.abstracta.jmeter.javadsl.JmeterDsl.*;

import java.io.IOException;
import org.apache.http.entity.ContentType;
import org.junit.jupiter.api.Test;
import us.abstracta.jmeter.javadsl.core.controllers.DslTransactionController;

public class PerformanceTest {

  private DslTransactionController login(String baseUrl) {
    return transaction("login",
        httpSampler(baseUrl),
        httpSampler(baseUrl + "/login")
            .post("user=test&password=test", ContentType.APPLICATION_FORM_URLENCODED)
    );
  }

  private DslTransactionController addItemToCart(String baseUrl) {
    return transaction("addItemToCart",
        httpSampler(baseUrl + "/items"),
        httpSampler(baseUrl + "/cart/items")
            .post("{\"id\": 1}", ContentType.APPLICATION_JSON)
    );
  }

  @Test
  public void testTransactions() throws IOException {
    String baseUrl = "http://my.service";
    testPlan(
        threadGroup(2, 10,
            login(baseUrl),
            addItemToCart(baseUrl)
        )
    ).run();
  }

}
CSV as input data for requests
Sometimes is necessary to run the same flow but using different pre-defined data on each request. For example, a common use case is to use a different user (from a given set) in each request.
This can be easily achieved using the provided csvDataSet element. For example, having a file like this one:
USER,PASS
user1,pass1
user2,pass2
You can implement a test plan that tests recurrent login with the two users with something like this:
import static org.assertj.core.api.Assertions.assertThat;
import static us.abstracta.jmeter.javadsl.JmeterDsl.*;

import java.io.IOException;
import java.time.Duration;
import org.apache.jmeter.protocol.http.util.HTTPConstants;
import org.apache.http.entity.ContentType;
import org.junit.jupiter.api.Test;
import us.abstracta.jmeter.javadsl.core.TestPlanStats;

public class PerformanceTest {

  @Test
  public void testPerformance() throws IOException {
    TestPlanStats stats = testPlan(
        csvDataSet("users.csv"),
        threadGroup(5, 10,
            httpSampler("http://my.service/login")
                .post("{\"${USER}\": \"${PASS}\"", ContentType.APPLICATION_JSON),
            httpSampler("http://my.service/logout")
                .method(HTTPConstants.POST)
        )
    ).run();
    assertThat(stats.overall().sampleTimePercentile99()).isLessThan(Duration.ofSeconds(5));
  }

}
TIP
To properly format the data in your CSV, a general rule you can apply is to replace each double quotes with two double quotes and add double quotes to the beginning and end of each CSV value.
E.g.: if you want one CSV field to contain the value {"field": "value"}, then use "{""field:"": ""value""}".
This way, with a simple search and replace, you can include in a CSV field any format like JSON, XML, etc.
Note: JMeter uses should be aware that JMeter DSL csvDataSet sets Allowed quoted data? flag, in associated Csv Data Set Config element, to true.
By default, the CSV file will be opened once and shared by all threads. This means that when one thread reads a CSV line in one iteration, then the following thread reading a line will continue with the following line.
If you want to change this (to share the file per thread group or use one file per thread), then you can use the provided sharedIn method like in the following example:
import us.abstracta.jmeter.javadsl.core.configs.DslCsvDataSet.Sharing;
...
  TestPlanStats stats = testPlan(
      csvDataSet("users.csv")
        .sharedIn(Sharing.THREAD),
      threadGroup(5, 10,
          httpSampler("http://my.service/login")
            .post("{\"${USER}\": \"${PASS}\"", Type.APPLICATION_JSON),
          httpSampler("http://my.service/logout")
            .method(HTTPConstants.POST)
      )
  )
:::
WARNING
You can use the randomOrder() method to get CSV lines in random order (using Random CSV Data Set plugin), but this is less performant as getting them sequentially, so use it sparingly.
Check DslCsvDataSet for additional details and options (like changing delimiter, handling files without headers line, stopping on the end of file, etc.).
Counter
In scenarios that you need unique value for each request, for example for id parameters, you can use counter which provides easy means to have an auto incremental value that can be used in requests.
Here is an example:
testPlan(
    threadGroup(1, 10,
        counter("USER_ID")
            .startingValue(1000), // will generate 1000, 1001, 1002...
        httpSampler(wiremockUri + "/${USER_ID}")
    )
).run();
Check DslCounter for more details.
Provide request parameters programmatically per request
So far we have seen a few ways to generate requests with information extracted from CSV or through a counter, but this is not enough for some scenarios. When you need more flexibility and power you can use jsr223preProcessor to specify your own logic to build each request.
Here is an example:
import static org.assertj.core.api.Assertions.assertThat;
import static us.abstracta.jmeter.javadsl.JmeterDsl.*;

import java.io.IOException;
import java.time.Duration;
import org.apache.jmeter.threads.JMeterVariables;
import org.apache.http.entity.ContentType;
import org.junit.jupiter.api.Test;
import us.abstracta.jmeter.javadsl.core.TestPlanStats;

public class PerformanceTest {

  @Test
  public void testPerformance() throws IOException {
    TestPlanStats stats = testPlan(
        threadGroup(2, 10,
            httpSampler("http://my.service")
                .post("${REQUEST_BODY}", ContentType.TEXT_PLAIN)
                .children(
                    jsr223PreProcessor("vars.put('REQUEST_BODY', " + getClass().getName()
                        + ".buildRequestBody(vars))")
                )
        )
    ).run();
    assertThat(stats.overall().sampleTimePercentile99()).isLessThan(Duration.ofSeconds(5));
  }

  public static String buildRequestBody(JMeterVariables vars) {
    String countVarName = "REQUEST_COUNT";
    Integer countVar = (Integer) vars.getObject(countVarName);
    int count = countVar != null ? countVar + 1 : 1;
    vars.putObject(countVarName, count);
    return "MyBody" + count;
  }

}
You can also use a Java lambda instead of providing Groovy script, which benefits from Java type safety & IDEs code auto-completion and consumes less CPU:
jsr223PreProcessor(s -> s.vars.put("REQUEST_BODY", buildRequestBody(s.vars)))
Or even use this shorthand:
post(s -> buildRequestBody(s.vars), Type.TEXT_PLAIN)
WARNING
Even though using Java Lambdas has several benefits, they are also less portable. Check this section for more details.
TIP
jsr223PreProcessor is quite powerful. But, provided example can easily be achieved through the usage of counter element.
Check DslJsr223PreProcessor & DslHttpSampler for more details and additional options.
Timers
Emulate user delays between requests
Sometimes, is necessary to be able to properly replicate users' behavior, and in particular the time the users take between sending one request and the following one. For example, to simulate the time it will take to complete a purchase form. JMeter (and the DSL) provide a few alternatives for this.
If you just want to add 1 pause between two requests, you can use the threadPause method like in the following example:
import java.io.IOException;
import java.time.Duration;
import org.apache.http.entity.ContentType;
import org.junit.jupiter.api.Test;

public class PerformanceTest {

  @Test
  public void test() throws IOException {
    testPlan(
        threadGroup(2, 10,
            httpSampler("http://my.service/items"),
            threadPause(Duration.ofSeconds(4)),
            httpSampler("http://my.service/cart/selected-items")
                .post("{\"id\": 1}", ContentType.APPLICATION_JSON)
        )
    ).run();
  }

}
Using threadPause is a good solution for adding individual pauses, but if you want to add pauses across several requests, or sections of test plan, then using a constantTimer or uniformRandomTimer is better. Here is an example that adds a delay of between 4 and 10 seconds for every request in the test plan:
import java.io.IOException;
import java.time.Duration;
import org.apache.http.entity.ContentType;
import org.junit.jupiter.api.Test;

public class PerformanceTest {

  @Test
  public void testTransactions() throws IOException {
    testPlan(
        threadGroup(2, 10,
            uniformRandomTimer(Duration.ofSeconds(4), Duration.ofSeconds(10)),
            transaction("addItemToCart",
                httpSampler("http://my.service/items"),
                httpSampler("http://my.service/cart/selected-items")
                    .post("{\"id\": 1}", ContentType.APPLICATION_JSON)
            ),
            transaction("checkout",
                httpSampler("http://my.service/cart/chekout"),
                httpSampler("http://my.service/cart/checkout/userinfo")
                    .post(
                        "{\"Name\": Dave, \"lastname\": Tester, \"Street\": 1483  Smith Road, \"City\": Atlanta}",
                        ContentType.APPLICATION_JSON)
            )
        )
    ).run();
  }

}
TIP
As you may have noticed, timer order in relation to samplers, doesn't matter. Timers apply to all samplers in their scope, adding a pause after pre-processor executions and before the actual sampling. threadPause order, on the other hand, is relevant, and the pause will only execute when previous samplers in the same scope have run and before following samplers do.
WARNING
uniformRandomTimer minimum and maximum parameters differ from the ones used by JMeter Uniform Random Timer element, to make it simpler for users with no JMeter background.
The generated JMeter test element uses the Constant Delay Offset set to minimum value, and the Maximum random delay set to (maximum - minimum) value.
Control throughput
To achieve a specific constant throughput for specific samplers or section of a test plan, you can use throughputTimer, which uses JMeter ConstantThroughputTimer.
Here is an example for generating a maximum of 120 samples per minute:
import static org.assertj.core.api.Assertions.assertThat;
import static us.abstracta.jmeter.javadsl.JmeterDsl.*;

import java.time.Duration;
import org.junit.jupiter.api.Test;
import us.abstracta.jmeter.javadsl.core.TestPlanStats;

public class PerformanceTest {

  @Test
  public void testPerformance() throws Exception {
    testPlan(
        threadGroup(10, Duration.ofSeconds(10),
            throughputTimer(120),
            httpSampler("http://my.service")
        )
    ).run();
  }

}
TIP
By default, throughtputTimer will control throughput among active threads. If you want to control throughput per thread, i.e. each thread generating the specified throughput, which means that totalThoughput = configuredThroughput * numberOfThreads, you can use perThread() method.
TIP
The placement (scope) of the throughputTimer will determine its behaviour. E.g. if you place the timer inside an ifController, it will only control the execution throughput only for elements inside the ifController, or if you place it inside a threadGroup other thread groups execution will be directly not affected (nor they would directly affect this timer execution).
TIP
The timer uses by default even distribution of throughput among the active threads. This means that if you have 10 threads and specify 10 tpm, then each thread will try to execute at 1tpm, not adjusting each thread tpm if some other thread was far from achieving the configured tpm. If you want more precise throughput control, you can use .calculation() method, for example, with THREAD_GROUP_ACCURATE, but doing so, may lead to unexpected behavior when using multiple timers in same thread group.
Check DslThroughputTimer for more details.
WARNING
throughputTimer works by pausing requests to achieve a constant throughput, so the response times and number of threads must be sufficient to achieve the target throughput. You can think of this timer as a way to limit the maximum throughput, but it does have no way to generate more load if response times are high and threads are not enough. To automatically adjust threads when response times are high you can use rpsThreadGroup as described here.
WARNING
On first invocation of throughputTimer on each thread, no delay will be generated by the timer, which may lead to initially higher throughput than expected.
For example, in previously provided example, 10 requests (1 for each thread) will run without "throughput control", which means you will get 10 requests at once, and after that, you will get 1 request per second (as expected).
Requests synchronization
Usually, samples generated by different threads in a test plan thread group start deviating from each other according to the different durations each of them may experience.
Here is a diagram depicting this behavior, extracted from this nice example provided by one of JMeter DSL users:
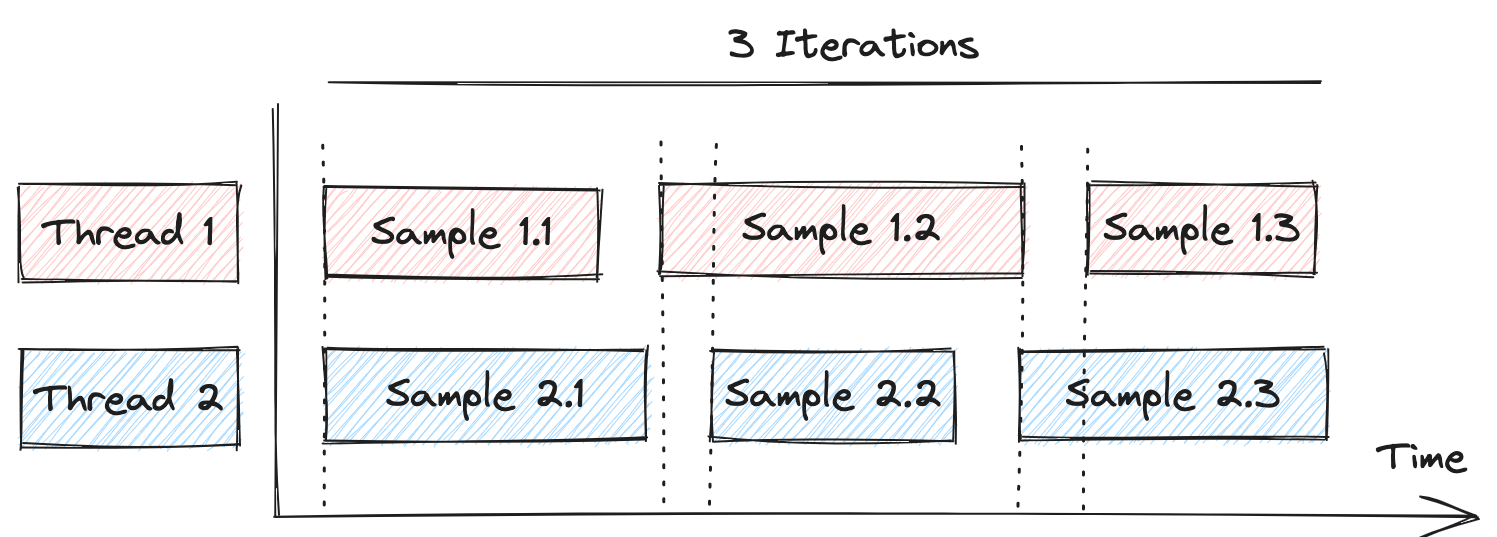
In most cases this is ok. But, if you want to generate batches of simultaneous requests to a system under test, this variability will prevent you from getting the expected behavior.
So, to synchronize requests, by holding some of them until all are in sync, like in this diagram:
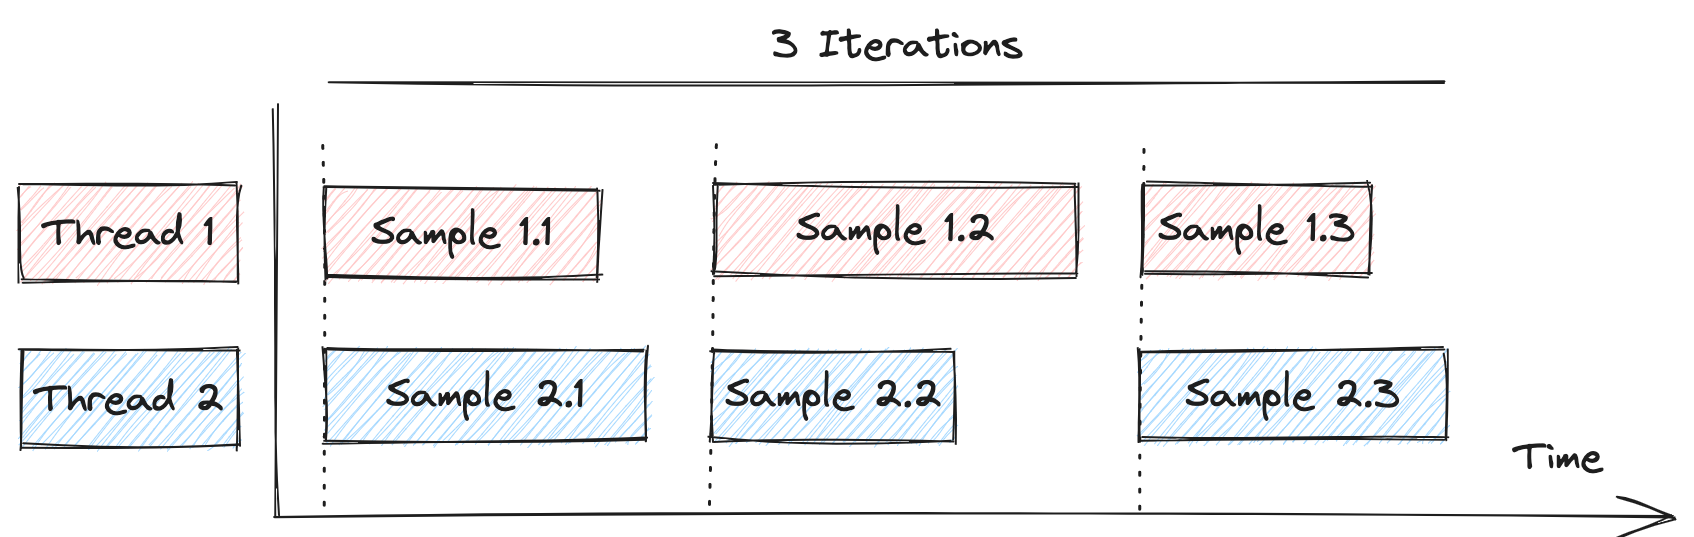
You can use synchronizingTimer like in the following example:
testPlan(
    threadGroup(2, 3,
      httpSample("https://mysite"),
      synchronizingTimer()
    )
)
Execute part of a test plan part a fraction of the times
In some cases, you may want to execute a given part of the test plan not in every iteration, and only for a given percent of times, to emulate certain probabilistic nature of the flow the users execute.
In such scenarios, you may use percentController, which uses JMeter Throughput Controller to achieve exactly that.
Here is an example:
import static org.assertj.core.api.Assertions.assertThat;
import static us.abstracta.jmeter.javadsl.JmeterDsl.*;

import java.time.Duration;
import org.junit.jupiter.api.Test;
import us.abstracta.jmeter.javadsl.core.TestPlanStats;

public class PerformanceTest {

  @Test
  public void testPerformance() throws Exception {
    TestPlanStats stats = testPlan(
        threadGroup(2, 10,
            percentController(40, // run this 40% of the times
                httpSampler("http://my.service/status"),
                httpSampler("http://my.service/poll")),
            percentController(70, // run this 70% of the times
                httpSampler("http://my.service/items"))
        )
    ).run();
    assertThat(stats.overall().sampleTimePercentile99()).isLessThan(Duration.ofSeconds(5));
  }

}
Check PercentController for more details.
Switch between test plan parts with a given probability
In some cases, you need to switch in a test plan between different behaviors assigning to them different probabilities. The main difference between this need and the previous one is that in each iteration you have to execute one of the parts, while in the previous case you might get multiple or no part executed on a given iteration.
For this scenario you can use weightedSwitchCotroller, like in this example:
import static org.assertj.core.api.Assertions.assertThat;
import static us.abstracta.jmeter.javadsl.JmeterDsl.*;

import java.io.IOException;
import java.time.Duration;
import org.junit.jupiter.api.Test;
import us.abstracta.jmeter.javadsl.core.TestPlanStats;

public class PerformanceTest {

  @Test
  public void testPerformance() throws IOException {
    TestPlanStats stats = testPlan(
        threadGroup(2, 10,
            weightedSwitchController()
                .child(30, httpSampler("https://myservice/1")) // will run 30/(30+20)=60% of the iterations
                .child(20, httpSampler("https://myservice/2")) // will run 20/(30+20)=40% of the iterations
        )
    ).run();
    assertThat(stats.overall().sampleTimePercentile99()).isLessThan(Duration.ofSeconds(5));
  }

}
DslWeightedSwitchController for more details.
Parallel requests
JMeter provides two main ways for running requests in parallel: thread groups and HTTP samplers downloading embedded resources in parallel. But in some cases is necessary to run requests in parallel which can't be properly modeled with previously mentioned scenarios. For such cases, you can use paralleController which allows using the Parallel Controller plugin to execute a given set of requests in parallel (while in a JMeter thread iteration step).
To use it, add the following dependency to your project:
<dependency>
  <groupId>us.abstracta.jmeter</groupId>
  <artifactId>jmeter-java-dsl-parallel</artifactId>
  <version>2.2</version>
  <scope>test</scope>
</dependency>
testImplementation 'us.abstracta.jmeter:jmeter-java-dsl-dashboard:2.2'
And use it, like in the following example:
import static org.assertj.core.api.Assertions.assertThat;
import static us.abstracta.jmeter.javadsl.JmeterDsl.*;
import static us.abstracta.jmeter.javadsl.parallel.ParallelController.*;

import java.time.Duration;
import org.junit.jupiter.api.Test;
import us.abstracta.jmeter.javadsl.core.TestPlanStats;

public class PerformanceTest {

  @Test
  public void testPerformance() throws Exception {
    TestPlanStats stats = testPlan(
        threadGroup(2, 10,
            parallelController(
                httpSampler("http://my.service/status"),
                httpSampler("http://my.service/poll"))
        )
    ).run();
    assertThat(stats.overall().sampleTimePercentile99()).isLessThan(Duration.ofSeconds(5));
  }

}
TIP
By default, the controller has no limit on the number of parallel requests per JMeter thread. You can set a limit by using provided maxThreads(int) method. Additionally, you can opt to aggregate children's results in a parent sampler using generateParentSample(boolean) method, in a similar fashion to the transaction controller.
TIP
When requesting embedded resources of an HTML response, prefer using downloadEmbeddedResources() method in httpSampler instead. Likewise, when you just need independent parts of a test plan to execute in parallel, prefer using different thread groups for each part.
Check ParallelController for additional info.
JMeter variables & properties
Variables
In general, when you want to reuse a certain value of your script, you can, and is the preferred way, just to use Java variables. In some cases though, you might need to pre-initialize some JMeter thread variable (for example to later be used in an ifController) or easily update its value without having to use a jsr223 element for that. For these cases, the DSL provides the vars() method.
Here is an example:
import static us.abstracta.jmeter.javadsl.JmeterDsl.*;

import org.junit.jupiter.api.Test;

public class PerformanceTest {

  @Test
  public void testPerformance() throws Exception {
    String pageVarName = "PAGE";
    String firstPage = "1";
    String endPage = "END";
    testPlan(
        vars()
            .set(pageVarName, firstPage),
        threadGroup(2, 10,
            ifController(s -> !s.vars.get(pageVarName).equals(endPage),
                httpSampler("http://my.service/accounts?page=${" + pageVarName +"}")
                    .children(
                        regexExtractor(pageVarName, "next=.*?page=(\\d+)")
                            .defaultValue(endPage)
                    )
            ),
            ifController(s -> s.vars.get(pageVarName).equals(endPage),
                vars()
                    .set(pageVarName, firstPage)
            )
        )
    ).run();
  }

}
WARNING
For special consideration of existing JMeter users:
vars() internally uses JMeter User Defined Variables (aka UDV) when placed as a test plan child, but a JSR223 sampler otherwise. This decision avoids several non-intuitive behaviors of JMeter UDV which are listed in red blocks in the JMeter component documentation.
Internally using a JSR223 sampler, allows DSL users to properly scope a variable to where it is placed (eg: defining a variable in one thread has no effect on other threads or thread groups), set the value when it's actually needed (not just at the beginning of test plan execution), and support cross-variable references (i.e.: if var1=test and var2=${var1}, then the value of var2 would be solved to test).
When vars() is located as a direct child of the test plan, due to the usage of UDV, declared variables will be available to all thread groups and no variable cross-reference is supported.
Check DslVariables for more details.
Properties
You might reach a point where you want to pass some parameter to the test plan or want to share some object or data that is available for all threads to use. In such scenarios, you can use JMeter properties.
JMeter properties is a map of keys and values, that is accessible to all threads. To access them you can use ${__P(PROPERTY_NAME)} or equivalent ${__property(PROPERTY_NAME) inside almost any string, props['PROPERTY_NAME'] inside groovy scripts or props.get("PROPERTY_NAME") in lambda expressions.
To set them, you can use prop() method included in EmbeddedJmeterEngine like in the following example:
import static us.abstracta.jmeter.javadsl.JmeterDsl.*;

import org.junit.jupiter.api.Test;
import us.abstracta.jmeter.javadsl.core.engines.EmbeddedJmeterEngine;

public class PerformanceTest {

  @Test
  public void testProperties() {
    testPlan(
        threadGroup(1, 1,
            httpSampler("http://myservice.test/${__P(MY_PROP)}")
        )
    ).runIn(new EmbeddedJmeterEngine()
        .prop("MY_PROP", "MY_VAL"));
  }

}
Or you can set them in groovy or java code, like in the following example:
import static us.abstracta.jmeter.javadsl.JmeterDsl.*;

import org.junit.jupiter.api.Test;

public class PerformanceTest {

  @Test
  public void testProperties() {
    testPlan(
        threadGroup(1, 1,
            jsr223Sampler("props.put('MY_PROP', 'MY_VAL')"),
            httpSampler("http://myservice.test/${__P(MY_PROP)}")
        )
    ).run();
  }

}
Or you can even load them from a file, which might be handy to have different files with different values for different execution profiles (eg: different environments). Eg:
import static us.abstracta.jmeter.javadsl.JmeterDsl.*;

import org.junit.jupiter.api.Test;
import us.abstracta.jmeter.javadsl.core.engines.EmbeddedJmeterEngine;

public class PerformanceTest {

  @Test
  public void testProperties() {
    testPlan(
        threadGroup(1, 1,
            httpSampler("http://myservice.test/${__P(MY_PROP)}")
        )
    ).runIn(new EmbeddedJmeterEngine()
        .propertiesFile("my.properties"));
  }

}
TIP
You can put any object (not just strings) in properties, but only strings can be accessed via ${__P(PROPERTY_NAME)} and ${__property(PROPERTY_NAME)}.
Being able to put any kind of object allows you to do very powerful stuff, like implementing a custom cache, or injecting some custom logic to a test plan.
TIP
You can also specify properties through JVM system properties either by setting JVM parameter -D or using System.setProperty() method.
When properties are set as JVM system properties, they are not accessible via props[PROPERTY_NAME] or props.get("PROPERTY_NAME"). If you need to access them from groovy or java code, then use props.getProperty("PROPERTY_NAME") instead.
WARNING
JMeter properties can currently only be used with EmbeddedJmeterEngine, so use them sparingly and prefer other mechanisms when available.
Test resources
When working with tests in maven projects, even gradle in some scenarios, it is usually necessary to use files hosted in src/test/resources. For example CSV files for csvDataSet, a file to be used by an httpSampler, some JSON for comparison, etc. The DSL provides testResource as a handy shortcut for such scenarios. Here is a simple example:
import static us.abstracta.jmeter.javadsl.JmeterDsl.*;

import java.io.IOException;
import org.junit.jupiter.api.Test;

public class PerformanceTest {

  @Test
  public void testProperties() throws IOException {
    testPlan(
        csvDataSet(testResource("users.csv")), // gets users info from src/test/resources/users.csv
        threadGroup(1, 1,
            httpSampler("http://myservice.test/users/${USER_ID}")
        )
    ).run();
  }

}
Check TestResource for some further details.
Protocols
HTTP
Throughout this guide, several examples have been shown for simple cases of HTTP requests (mainly how to do gets and posts), but the DSL provides additional features that you might need to be aware of.
Here we show some of them, but check JmeterDsl and DslHttpSampler to explore all available features.
Methods & body
As previously seen, you can do simple gets and posts like in the following snippet:
httpSampler("http://my.service") // A simple get
httpSampler("http://my.service")
    .post("{\"field\":\"val\"}", Type.APPLICATION_JSON) // simple post
But you can also use additional methods to specify any HTTP method and body:
httpSampler("http://my.service")
  .method(HTTPConstants.PUT)
  .contentType(Type.APPLICATION_JSON)
  .body("{\"field\":\"val\"}")
Additionally, when in need to generate dynamic URLs or bodies, you can use lambda expressions (as previously seen in some examples):
httpSampler("http://my.service")
  .post(s -> buildRequestBody(s.vars), Type.TEXT_PLAIN)
httpSampler("http://my.service")
  .body(s -> buildRequestBody(s.vars))
httpSampler(s -> buildRequestUrl(s.vars)) // buildRequestUrl is just an example of a custom method you could implement with your own logic
WARNING
As previously mentioned, even though using Java Lambdas has several benefits, they are also less portable. Check this section for more details.
Parameters
In many cases, you will need to specify some URL query string parameters or URL encoded form bodies. For these cases, you can use param method as in the following example:
import static us.abstracta.jmeter.javadsl.JmeterDsl.*;

import org.apache.jmeter.protocol.http.util.HTTPConstants;
import org.junit.jupiter.api.Test;

public class PerformanceTest {

  @Test
  public void test() throws Exception {
    String baseUrl = "https://myservice.com/products";
    testPlan(
        threadGroup(1, 1,
            // GET https://myservice.com/products?name=iron+chair
            httpSampler("GetIronChair", baseUrl)
                .param("name", "iron chair"),
            /*
             * POST https://myservice.com/products
             * Content-Type: application/x-www-form-urlencoded
             *
             * name=wooden+chair
             */
            httpSampler("CreateWoodenChair", baseUrl)
                .method(HTTPConstants.POST) // POST
                .param("name", "wooden chair")
            )
    ).run();
  }

}
TIP
JMeter automatically URL encodes parameters, so you don't need to worry about special characters in parameter names or values.
If you want to use some custom encoding or have an already encoded value that you want to use, then you can use rawParam method instead which does not apply any encoding to the parameter name or value, and send it as is.
Headers
You might have already noticed in some of the examples that we have shown already some ways to set some headers. For instance, in the following snippet Content-Type header is being set in two different ways:
httpSampler("http://my.service")
  .post("{\"field\":\"val\"}", Type.APPLICATION_JSON)
httpSampler("http://my.service")
  .contentType(Type.APPLICATION_JSON)
These are handy methods to specify the Content-Type header, but you can also set any header on a particular request using provided header method, like this:
httpSampler("http://my.service")
  .header("X-First-Header", "val1")
  .header("X-Second-Header", "val2")
Additionally, you can specify headers to be used by all samplers in a test plan, thread group, transaction controllers, etc. For this you can use httpHeaders like this:
testPlan(
    threadGroup(2, 10,
        httpHeaders()
          .header("X-Header", "val1"),
        httpSampler("http://my.service"),
        httpSampler("http://my.service/users")
    )
).run();
TIP
You can also use lambda expressions for dynamically building HTTP Headers, but the same limitations apply as in other cases (running in BlazeMeter, OctoPerf, Azure, or using generated JMX file).
Authentication
When in need to authenticate user associated to an HTTP request you can either use httpAuth or custom logic (with HTTP headers, regex extractors, variables, and other potential elements) to properly generate the required requests.
httpAuth greatly simplifies common scenarios like this example using basic auth:
String baseUrl = "http://my.service";
testPlan(
    httpAuth()
        .basicAuth(baseUrl, System.getenv("AUTH_USER"), System.getenv("AUTH_PASSWORD")),
    threadGroup(2, 10,
        httpSampler(baseUrl + "/login"),
        httpSampler(baseUrl + "/users")
    )
).run();
TIP
Even though you can specify an empty base URL to match any potential request, don't do it. Defining a non-specific enough base URL, may leak credentials to unexpected sites, for example, when used in combination with downloadEmbeddedResources().
TIP
Avoid including credentials in repository where code is hosted, which might lead to security leaks.
In provided example credentials are obtained from environment variable that have to be predefined by user when running tests, but you can also use other approaches to avoid security leaks.
Also take into consideration that if you use jtlWriter and chose to store HTTP request headers and/or bodies, then JTL could include used credentials and might be also a potential source for security leaks.
TIP
Http Authorization Manager, the element used by httpAuth, automatically adds the Authorization header for each request that starts with the given base url. If you need more control (e.g.: only send the header in the first request or under certain condition), you might add httpAuth only to specific requests or just build custom logic through usage of httpHeaders, regexExtractor and jsr223PreProcessor.
TIP
Currently httpAuth() only provides basicAuth method. If you need other scenarios, please let us know by creating an issue in the repository.
You can check additional details in DslAuthManager.
Multipart requests
When you need to upload files to an HTTP server or need to send a complex request body, you will in many cases require sending multipart requests. To send a multipart request just use bodyPart and bodyFilePart methods like in the following example:
import static us.abstracta.jmeter.javadsl.JmeterDsl.*;

import org.apache.http.entity.ContentType;
import org.apache.jmeter.protocol.http.util.HTTPConstants;
import org.junit.jupiter.api.Test;

public class PerformanceTest {

  @Test
  public void test() throws Exception {
    testPlan(
        threadGroup(1, 1,
            httpSampler("https://myservice.com/report")
                .method(HTTPConstants.POST)
                .bodyPart("myText", "Hello World", ContentType.TEXT_PLAIN)
                .bodyFilePart("myFile", "myReport.xml", ContentType.TEXT_XML)
        )
    ).run();
  }

}
Cookies & caching
jmeter-java-dsl automatically adds a cookie manager and cache manager for automatic HTTP cookie and caching handling, emulating a browser behavior. If you need to disable them you can use something like this:
testPlan(
    httpCookies().disable(),
    httpCache().disable(),
    threadGroup(2, 10,
        httpSampler("http://my.service")
    )
)
Timeouts
By default, JMeter uses system default configurations for connection and response timeouts (maximum time for a connection to be established or a server response after a request, before it fails). This is might make the test behave different depending on the machine where it runs. To avoid this, it is recommended to always set these values. Here is an example:
testPlan(
    httpDefaults()
        .connectionTimeout(Duration.ofSeconds(10))
        .responseTimeout(Duration.ofMinutes(1)),
    threadGroup(2, 10,
        httpSampler("http://my.service")
    )
)
WARNING
Currently we are using same defaults as JMeter to avoid breaking existing test plans executions, but in a future major version we plan to change default setting to avoid the common pitfall previously mentioned.
Connections
jmeter-java-dsl, as JMeter (and also K6), by default reuses HTTP connections between thread iterations to avoid common issues with port and file descriptors exhaustion which require manual OS tuning and may manifest in many ways.
This decision implies that the load generated from 10 threads and 100 iterations is not the same as the one generated by 1000 real users with up to 10 concurrent users in a given time, since the load imposed by each user connection and disconnection would only be generated once for each thread.
If you need for each iteration to reset connections you can use something like this:
httpDefaults()
    .resetConnectionsBetweenIterations()
If you use this setting you might want to take a look at "Config your environment" section of this article to avoid port and file descriptors exhaustion.
TIP
Connections are configured by default with a TTL (time-to-live) of 1 minute, which you can easily change like this:
httpDefaults()
    .connectionTtl(Duration.ofMinutes(10))
- This and
resetConnectionsBetweenIterationsapply at the JVM level (due to JMeter limitation), so they affect all requests in the test plan and other ones potentially running in the same JVM instance.
WARNING
Using clientImpl(HttpClientImpl.JAVA) will ignore any of the previous settings and will reuse connections depending on JVM implementation.
Embedded resources
Sometimes you may need to reproduce a browser behavior, downloading for a given URL all associated resources (images, frames, etc.).
jmeter-java-dsl allows you to easily reproduce this scenario by using the downloadEmbeddedResources method in httpSampler like in the following example:
import static org.assertj.core.api.Assertions.assertThat;
import static us.abstracta.jmeter.javadsl.JmeterDsl.*;

import java.io.IOException;
import java.time.Duration;
import org.junit.jupiter.api.Test;
import us.abstracta.jmeter.javadsl.core.TestPlanStats;

public class PerformanceTest {

  @Test
  public void testPerformance() throws IOException {
    TestPlanStats stats = testPlan(
        threadGroup(5, 10,
            httpSampler("http://my.service/")
                .downloadEmbeddedResources()
        )
    ).run();
    assertThat(stats.overall().sampleTimePercentile99()).isLessThan(Duration.ofSeconds(5));
  }

}
This will make JMeter automatically parse the HTTP response for embedded resources, download them and register embedded resources downloads as sub-samples of the main sample.
Check JMeter documentation for additional details on downloaded embedded resources.
TIP
You can use downloadEmbeddedResourcesNotMatching(urlRegex) and downloadEmbeddedResourcesMatching(urlRegex) methods if you need to ignore, or only download, some embedded resources requests. For example, when some requests are not related to the system under test.
WARNING
The DSL, unlike JMeter, uses by default concurrent download of embedded resources (with up to 6 parallel downloads), which is the most used scenario to emulate browser behavior.
WARNING
Using downloadEmbeddedResources doesn't allow to download all resources that a browser could download, since it does not execute any JavaScript. For instance, resources URLs solved through JavaScript or direct JavaScript requests will not be requested. Even with this limitation, in many cases just downloading "static" resources is a good enough solution for performance testing.
Redirects
When jmeter-java-dsl (using JMeter logic) detects a redirection, it will automatically do a request to the redirected URL and register the redirection as a sub-sample of the main request.
If you want to disable such logic, you can just call .followRedirects(false) in a given httpSampler.
Keep alive
By default, JMeter Java DSL uses a persistent HTTP connection (sending the Connection: keep-alive header) to reuse the same socket for multiple requests to the same server.
To force server to close the connection after each request, you can disable keep-alive with .useKeepAlive(false) either on an individual httpSampler or globally on httpDefaults.
This can be useful when you’re load-testing an API that enforces a strict limit on the number of simultaneous sockets per client. If you leave keep-alive enabled, each thread will hold its socket open for the duration of the test, consuming the server's connection resources.
import static us.abstracta.jmeter.javadsl.JmeterDsl.*;
import org.junit.jupiter.api.Test;
public class PerformanceTest {

  @Test
  public void test1() throws Exception {
    testPlan(
        threadGroup(1, 10,
            //Disable keep-alive for this sampler: sends Connection: close header and close the connection after this request
            httpSampler("https://myservice1.com")
                .useKeepAlive(false),
            // Explicitly enable keep-alive for this sampler: sends Connection: keep-alive header and keeps the connection open
            httpSampler("https://myservice2.com")
                .useKeepAlive(true),
            //No keep-alive configuration, so it will use the default keep-alive behavior (keep-alive enabled)
            httpSampler("https://myservice3.com")
        )
    ).run();
  }

  @Test
  public void test2() throws Exception {
    testPlan(
        //Disable keep-alive globally for all samplers in this test plan
        httpDefaults()
            .useKeepAlive(false),
        threadGroup(1, 10,
            // These samplers inherit keep-alive disabled from httpDefaults()
            httpSampler("https://myservice1.com"),
            httpSampler("https://myservice2.com"),
            // Explicitly enable keep-alive for this sampler overriding the global setting
            httpSampler("https://myservice3.com")
                .useKeepAlive(true)
       )
    ).run();
  }

}
HTTP defaults
Whenever you need to use some repetitive value or common setting among HTTP samplers (and any part of the test plan) the preferred way (due to readability, debugability, traceability, and in some cases simplicity) is to create a Java variable or custom builder method.
For example:
import static us.abstracta.jmeter.javadsl.JmeterDsl.*;

import java.io.IOException;
import org.apache.http.entity.ContentType;
import org.junit.jupiter.api.Test;
import us.abstracta.jmeter.javadsl.http.DslHttpSampler;

public class PerformanceTest {

  @Test
  public void performanceTest() throws IOException {
    String host = "myservice.my";
    testPlan(
        threadGroup(10, 100,
            productCreatorSampler(host, "Rubber"),
            productCreatorSampler(host, "Pencil")
        )
    ).run();
  }

  private DslHttpSampler productCreatorSampler(String host, String productName) {
    return httpSampler("https://" + host + "/api/product")
        .post("{\"name\": \"" + productName + "\"}", ContentType.APPLICATION_JSON);
  }

}
In some cases though, it might be simpler to just use provided httpDefaults method, like in the following example:
import static us.abstracta.jmeter.javadsl.JmeterDsl.*;

import java.io.IOException;
import org.junit.jupiter.api.Test;

public class PerformanceTest {

  @Test
  public void performanceTest() throws IOException {
    testPlan(
        httpDefaults()
            .url("https://myservice.my")
            .downloadEmbeddedResources(),
        threadGroup(10, 100,
            httpSampler("/products"),
            httpSampler("/cart")
        )
    ).run();
  }

}
Check DslHttpDefaults for additional details on available default options.
Overriding URL protocol, host or port
In some cases, you might want to use a default base URL but some particular requests may require some part of the URL to be different (eg: protocol, host, or port).
The preferred way (due to maintainability, language & IDE provided features, traceability, etc) of doing this, as with defaults, is using java code. Eg:
import static us.abstracta.jmeter.javadsl.JmeterDsl.*;

import org.junit.jupiter.api.Test;

public class PerformanceTest {

  @Test
  public void test() throws Exception {
    String protocol = "https://";
    String host = "myservice.com";
    String baseUrl = protocol + host;
    testPlan(
        threadGroup(1, 1,
            httpSampler(baseUrl + "/products"),
            httpSampler(protocol + "api." + host + "/cart"),
            httpSampler(baseUrl + "/stores")
        )
    ).run();
  }

}
But in some cases, this might be too verbose, or unnatural for users with existing JMeter knowledge. In such cases you can use provided methods (protocol, host & port) to just specify the part you want to modify for the sampler like in the following example:
import static us.abstracta.jmeter.javadsl.JmeterDsl.*;

import org.junit.jupiter.api.Test;

public class PerformanceTest {

  @Test
  public void test() throws Exception {
    testPlan(
        threadGroup(1, 1,
            httpDefaults()
                .url("https://myservice.com"),
            httpSampler("/products"),
            httpSampler("/cart")
                .host("subDomain.myservice.com"),
            httpSampler("/stores")
        )
    ).run();
  }

}
Proxy
Sometimes, due to company policies, some infrastructure requirement or just to further analyze or customize requests, for example, through the usage of tools like fiddler and mitmproxy, you need to specify a proxy server through which HTTP requests are sent to their final destination. This can be easily done with proxy method, like in the following example:
import static us.abstracta.jmeter.javadsl.JmeterDsl.*;

import org.junit.jupiter.api.Test;

public class PerformanceTest {

  @Test
  public void test() throws Exception {
    testPlan(
        threadGroup(1, 1,
            httpSampler("https://myservice.com")
                .proxy("http://myproxy:8081")
        )
    ).run();
  }

}
TIP
You can also specify proxy authentication parameters with proxy(url, username, password) method.
TIP
When you need to set a proxy for several samplers, use httpDefaults().proxy methods.
GraphQL
When you want to test a GraphQL service, having properly set each field in an HTTP request and knowing the exact syntax for each of them, can quickly start becoming tedious. For this purpose, jmeter-java-dsl provides graphqlSampler. To use it you need to include this dependency:
<dependency>
  <groupId>us.abstracta.jmeter</groupId>
  <artifactId>jmeter-java-dsl-graphql</artifactId>
  <version>2.2</version>
  <scope>test</scope>
</dependency>
testImplementation 'us.abstracta.jmeter:jmeter-java-dsl-graphql:2.2'
And then you can make simple GraphQL requests like this:
import static us.abstracta.jmeter.javadsl.JmeterDsl.*;
import static us.abstracta.jmeter.javadsl.graphql.DslGraphqlSampler.*;

import org.junit.jupiter.api.Test;

public class PerformanceTest {

  @Test
  public void test() throws Exception {
    String url = "https://myservice.com";
    testPlan(
        threadGroup(1, 1,
            graphqlSampler(url, "{user(id: 1) {name}}"),
            graphqlSampler(url, "query UserQuery($id: Int) { user(id: $id) {name}}")
                .operationName("UserQuery")
                .variable("id", 2)
        )
    ).run();
  }

}
TIP
GraphQL Sampler is based on HTTP Sampler, so all test elements that affect HTTP Samplers, like httpHeaders, httpCookies, httpDefaults, and JMeter properties, also affect GraphQL sampler.
WARNING
grapqlSampler sets by default application/json Content-Type header.
This has been done to ease the most common use cases and to avoid users the common pitfall of missing the proper Content-Type header value.
If you need to modify graphqlSampler content type to be other than application/json, then you can use contentType method, potentially parameterizing it to reuse the same value in multiple samplers like in the following example:
import static us.abstracta.jmeter.javadsl.JmeterDsl.*;
import static us.abstracta.jmeter.javadsl.graphql.DslGraphqlSampler.*;

import org.apache.http.entity.ContentType;
import org.junit.jupiter.api.Test;
import us.abstracta.jmeter.javadsl.graphql.DslGraphqlSampler;

public class PerformanceTest {

  private DslGraphqlSampler myGraphqlRequest(String query) {
    return graphqlSampler("https://myservice.com", query)
        .contentType(ContentType.create("myContentType"));
  }

  @Test
  public void test() throws Exception {
    testPlan(
        threadGroup(1, 1,
            myGraphqlRequest("{user(id: 1) {name}}"),
            myGraphqlRequest("{user(id: 5) {address}}")
        )
    ).run();
  }

}
JDBC and databases interactions
Several times you will need to interact with a database to either set it to a known state while setting up the test plan, clean it up while tearing down the test plan, or even check or generate some values in the database while the test plan is running.
For these use cases, you can use JDBC DSL-provided elements.
Including the following dependency in your project:
<dependency>
  <groupId>us.abstracta.jmeter</groupId>
  <artifactId>jmeter-java-dsl-jdbc</artifactId>
  <version>2.2</version>
  <scope>test</scope>
</dependency>
testImplementation 'us.abstracta.jmeter:jmeter-java-dsl-jdbc:2.2'
And adding a proper JDBC driver for your database, like this example for PostgreSQL:
<dependency>
  <groupId>org.postgresql</groupId>
  <artifactId>postgresql</artifactId>
  <version>42.3.1</version>
  <scope>test</scope>
</dependency>
testImplementation 'org.postgresql:postgresql:42.3.1'
You can interact with the database like this:
import static org.assertj.core.api.Assertions.assertThat;
import static us.abstracta.jmeter.javadsl.JmeterDsl.*;
import static us.abstracta.jmeter.javadsl.jdbc.JdbcJmeterDsl.*;

import java.io.IOException;
import java.sql.Types;
import java.time.Duration;
import org.apache.http.entity.ContentType;
import org.junit.jupiter.api.Test;
import org.postgresql.Driver;
import us.abstracta.jmeter.javadsl.core.TestPlanStats;
import us.abstracta.jmeter.javadsl.jdbc.DslJdbcSampler;

public class PerformanceTest {

  @Test
  public void testPerformance() throws IOException {
    String jdbcPoolName = "pgLocalPool";
    String productName = "dsltest-prod";
    DslJdbcSampler cleanUpSampler = jdbcSampler(jdbcPoolName,
        "DELETE FROM products WHERE name = '" + productName + "'")
        .timeout(Duration.ofSeconds(10));
    TestPlanStats stats = testPlan(
        jdbcConnectionPool(jdbcPoolName, Driver.class, "jdbc:postgresql://localhost/my_db")
            .user("user")
            .password("pass"),
        setupThreadGroup(
            cleanUpSampler
        ),
        threadGroup(5, 10,
            httpSampler("CreateProduct", "http://my.service/products")
                .post("{\"name\", \"" + productName + "\"}", ContentType.APPLICATION_JSON),
            jdbcSampler("GetProductsIdsByName", jdbcPoolName,
                "SELECT id FROM products WHERE name=?")
                .param(productName, Types.VARCHAR)
                .vars("PRODUCT_ID")
                .timeout(Duration.ofSeconds(10)),
            httpSampler("GetLatestProduct",
                "http://my.service/products/${__V(PRODUCT_ID_${PRODUCT_ID_#})}")
        ),
        teardownThreadGroup(
            cleanUpSampler
        )
    ).run();
    assertThat(stats.overall().sampleTimePercentile99()).isLessThan(Duration.ofSeconds(5));
  }

}
TIP
Always specify a query timeout to quickly identify unexpected behaviors in queries.
TIP
Don't forget proper WHERE conditions in UPDATES and DELETES, and proper indexes for table columns participating in WHERE conditions 😊.
Check JdbcJmeterDsl for additional details and options and JdbcJmeterDslTest for additional examples.
Java API performance testing
Sometimes JMeter provided samplers are not enough for testing a particular technology, custom code, or service that requires some custom code to interact with. For these cases, you might use jsr223Sampler which allows you to use custom logic to generate a sample result.
Here is an example for load testing a Redis server:
import static org.assertj.core.api.Assertions.assertThat;
import static us.abstracta.jmeter.javadsl.JmeterDsl.*;

import java.io.IOException;
import java.time.Duration;
import org.junit.jupiter.api.Test;
import us.abstracta.jmeter.javadsl.core.TestPlanStats;

public class TestRedis {

  @Test
  public void shouldGetExpectedSampleResultWhenJsr223SamplerWithLambdaAndCustomResponse()
      throws IOException {
    TestPlanStats stats = testPlan(
        threadGroup(2, 10,
            jsr223Sampler("import redis.clients.jedis.Jedis\n"
                + "Jedis jedis = new Jedis('localhost', 6379)\n"
                + "jedis.connect()\n"
                + "SampleResult.connectEnd()\n"
                + "jedis.set('foo', 'bar')\n"
                + "return jedis.get(\"foo\")")
        )
    ).run();
    assertThat(stats.overall().sampleTimePercentile99()).isLessThan(Duration.ofMillis(500));
  }

}
TIP
Remember to add any particular dependencies required by your code. For example, the above example requires this dependency:
<dependency>
  <groupId>redis.clients</groupId>
  <artifactId>jedis</artifactId>
  <version>3.6.0</version>
  <scope>test</scope>
</dependency>
testImplementation 'redis.clients:jedis:3.6.0'
You can also use Java lambdas instead of Groovy script to take advantage of IDEs auto-completion, Java type safety, and less CPU consumption:
jsr223Sampler(v -> {
    SampleResult result = v.sampleResult;
    Jedis jedis = new Jedis("localhost", 6379);
    jedis.connect();
    result.connectEnd();
    jedis.set("foo", "bar");
    result.setResponseData(jedis.get("foo"), StandardCharsets.UTF_8.name());
})
WARNING
As previously mentioned, even though using Java Lambdas has several benefits, they are also less portable. Check this section for more details.
You may even use some custom logic that executes a particular logic when a thread group thread is created and finished. Here is an example:
public class TestRedis {

  public static class RedisSampler implements SamplerScript, ThreadListener {

    private Jedis jedis;

    @Override
    public void threadStarted() {
      jedis = new Jedis("localhost", 6379);
      jedis.connect();
    }

    @Override
    public void runScript(SamplerVars v) {
      jedis.set("foo", "bar");
      v.sampleResult.setResponseData(jedis.get("foo"), StandardCharsets.UTF_8.name());
    }

    @Override
    public void threadFinished() {
      jedis.close();
    }

  }

  @Test
  public void shouldGetExpectedSampleResultWhenJsr223SamplerWithLambdaAndCustomResponse()
      throws IOException {
    TestPlanStats stats = testPlan(
        threadGroup(2, 10,
            jsr223Sampler(RedisSampler.class)
        )
    ).run();
    assertThat(stats.overall().sampleTimePercentile99()).isLessThan(Duration.ofMillis(500));
  }

}
TIP
You can also make your class implement TestIterationListener to execute custom logic on each thread group iteration start, or LoopIterationListener to execute some custom logic on each iteration start (for example, each iteration of a forLoop).
TIP
When using public static classes in jsr223Sampler take into consideration that one instance of the class is created for each thread group thread and jsr223Sampler instance.
Note: jsr223Sampler is very powerful, but also makes code and test plans harder to maintain (as with any custom code) compared to using JMeter built-in samplers. So, in general, prefer using JMeter-provided samplers if they are enough for the task at hand, and use jsr223Sampler sparingly.
Check DslJsr223Sampler for more details and additional options.
Selenium
With JMeter DSL is quite simple to integrate your existing selenium scripts into performance tests. One common use case is to do real user monitoring or synthetics monitoring (get time spent in particular parts of a Selenium script) while the backend load is being generated.
Here is an example of how you can do this with JMeter DSL:
public class PerformanceTest {

  public static class SeleniumSampler implements SamplerScript, ThreadListener {

    private WebDriver driver;

    @Override
    public void threadStarted() {
      driver = new ChromeDriver(); // you can invoke existing set up logic to reuse it
    }

    @Override
    public void runScript(SamplerVars v) {
      driver.get("https://mysite"); // you can invoke existing selenium script for reuse here
    }

    @Override
    public void threadFinished() {
      driver.close(); // you can invoke existing tear down logic to reuse it
    }

  }

  @Test
  public void shouldGetExpectedSampleResultWhenJsr223SamplerWithLambdaAndCustomResponse()
      throws IOException {
    Duration testPlanDuration = Duration.ofMinutes(10);
    TestPlanStats stats = testPlan(
        threadGroup(1, testPlanDuration,
            jsr223Sampler("Real User Monitor", SeleniumSampler.class)
        ),
        threadGroup(100, testPlanDuration,
            httpSampler("https://mysite/products")
                .post("{\"name\": \"test\"}", Type.APPLICATION_JSON)
        )
    ).run();
    assertThat(stats.overall().sampleTimePercentile99()).isLessThan(Duration.ofMillis(500));
  }

}
Check previous section for more details on jsr223Sampler.
WebSocket
The DslWebsocketSampler class provides a Java DSL for creating WebSocket performance tests using JMeter. It supports the full WebSocket lifecycle including connection, data transmission, and disconnection operations. It is based on WebSocket Samplers by Peter Doornbosch plugin.
To use it, add the following dependency to your project:
<dependency>
  <groupId>us.abstracta.jmeter</groupId>
  <artifactId>jmeter-java-dsl-websocket</artifactId>
  <version>2.2</version>
  <scope>test</scope>
</dependency>
testImplementation 'us.abstracta.jmeter:jmeter-java-dsl-websocket:2.2'
Below you can see a basic usage example of WebSocket protocol.
import static us.abstracta.jmeter.javadsl.JmeterDsl.*;
import static us.abstracta.jmeter.javadsl.websocket.WebsocketJMeterDsl.*;
import us.abstracta.jmeter.javadsl.core.TestPlanStats;

public class Test {
    public static void main(String[] args) throws Exception {
        TestPlanStats stats = testPlan(
    threadGroup(1, 1,
        websocketConnect("wss://ws.postman-echo.com/raw"),
        websocketWrite("Hello WebSocket!"),
        websocketRead()
            .children(
                responseAssertion()
                    .equalsToStrings("Hello WebSocket!")
            ),
        websocketDisconnect()
        )
        ).run();
    }
}
WARNING
Only ws:// and wss:// protocols are supported. Using any other scheme will throw an IllegalArgumentException.
TIP
You can use a non-blocking read if necessary in the following way:
websocketRead().waitForResponse(false)
In this case, it is not recommended to add an assertion because the response could be empty.
WARNING
The WebSocket plugin only supports one connection per thread at a time. If you want to change the WebSocket server during execution, you should add a disconnect sampler and then establish a new connection.
Custom or yet not supported test elements
Whenever you find some JMeter test element or feature that is not yet supported by the DSL, we strongly encourage you to request it as an issue here or even contribute it to the DSL (check Contributing guide) so the entire community can benefit from it.
In some cases though, you might have some private custom test element that you don't want to publish or share with the rest of the community, or you are just really in a hurry and want to use it while the proper support is included in the DSL.
For such cases, the preferred approach is implementing a builder class for the test element. Eg:
import org.apache.jmeter.testelement.TestElement;
import us.abstracta.jmeter.javadsl.core.samplers.BaseSampler;

public class DslCustomSampler extends BaseSampler<DslCustomSampler> {

  private String myProp;

  private DslCustomSampler(String name) {
    super(name, CustomSamplerGui.class); // you can pass null here if custom sampler is a test bean
  }

  public DslCustomSampler myProp(String val) {
    this.myProp = val;
    return this;
  }

  @Override
  protected TestElement buildTestElement() {
    CustomSampler ret = new CustomSampler();
    ret.setMyProp(myProp);
    return ret;
  }

  public static DslCustomSampler customSampler(String name) {
    return new DslCustomSampler(name);
  }

}
Which you can use as any other JMeter DSL component, like in this example:
import static us.abstracta.jmeter.javadsl.DslCustomSampler.*;
import static us.abstracta.jmeter.javadsl.JmeterDsl.*;

import org.junit.jupiter.api.Test;

public class PerformanceTest {

  @Test
  public void test() throws Exception {
    testPlan(
        threadGroup(1, 1,
            customSampler("mySampler")
                .myProp("myVal")
            )
    ).run();
  }

}
This approach allows for easy reuse, compact and simple usage in tests, and you might even create your own CustomJmeterDsl class containing builder methods for many custom components.
Alternatively, when you want to skip creating subclasses, you might use the DSL wrapper module.
Include the module on your project:
<dependency>
  <groupId>us.abstracta.jmeter</groupId>
  <artifactId>jmeter-java-dsl-wrapper</artifactId>
  <version>2.2</version>
  <scope>test</scope>
</dependency>
testImplementation 'us.abstracta.jmeter:jmeter-java-dsl-wrapper:2.2'
And use a wrapper like in the following example:
import static us.abstracta.jmeter.javadsl.JmeterDsl.*;
import static us.abstracta.jmeter.javadsl.wrapper.WrapperJmeterDsl.*;

import org.junit.jupiter.api.Test;

public class PerformanceTest {

  @Test
  public void test() throws Exception {
    testPlan(
        threadGroup(1, 1,
            testElement("mySampler", new CustomSamplerGui()) // for test beans you can just provide the test bean instance
                .prop("myProp","myVal")
            )
    ).run();
  }

}
Check WrapperJmeterDsl for more details and additional wrappers.
JMX support
Save as JMX
In case you want to load a test plan in JMeter GUI, you can save it just invoking saveAsJMX method in the test plan as in the following example:
import static us.abstracta.jmeter.javadsl.JmeterDsl.*;

public class SaveTestPlanAsJMX {

  public static void main(String[] args) throws Exception {
    testPlan(
        threadGroup(2, 10,
            httpSampler("http://my.service")
        )
    ).saveAsJmx("dsl-test-plan.jmx");
  }

}
This can be helpful to share a Java DSL defined test plan with people not used to the DSL or to use some JMeter feature (or plugin) that is not yet supported by the DSL (but, we strongly encourage you to report it as an issue here so we can include such support into the DSL for the rest of the community).
TIP
If you get any error (like CannotResolveClassException) while loading the JMX in JMeter GUI, you can try copying jmeter-java-dsl jar (and any other potential modules you use) to JMeter lib directory, restart JMeter and try loading the JMX again.
TIP
If you want to migrate changes done in JMX to the Java DSL, you can use jmx2dsl as an accelerator. The resulting plan might differ from the original one, so sometimes it makes sense to use it, and some it is faster just to port the changes manually.
WARNING
If you use JSR223 Pre- or Post-processors with Java code (lambdas) instead of strings or use one of the HTTP Sampler methods which receive a function as a parameter, then the exported JMX will not work in JMeter GUI. You can migrate them to use jsrPreProcessor with string scripts instead.
Run JMX file
jmeter-java-dsl also provides means to easily run a test plan from a JMX file either locally, in BlazeMeter (through previously mentioned jmeter-java-dsl-blazemeter module), OctoPerf (through jmeter-java-dsl-octoperf module), or Azure Load testing (through jmeter-java-dsl-azure module). Here is an example:
import static org.assertj.core.api.Assertions.assertThat;

import java.io.IOException;
import java.time.Duration;
import org.junit.jupiter.api.Test;
import us.abstracta.jmeter.javadsl.core.DslTestPlan;
import us.abstracta.jmeter.javadsl.core.TestPlanStats;

public class RunJmxTestPlan {

  @Test
  public void testPerformance() throws IOException {
    TestPlanStats stats = DslTestPlan.fromJmx("test-plan.jmx").run();
    assertThat(stats.overall().sampleTimePercentile99()).isLessThan(Duration.ofSeconds(5));
  }

}
This can be used to just run existing JMX files, or when DSL has no support for some JMeter functionality or plugin (although you can use wrappers for this), and you need to use JMeter GUI to build the test plan but still want to use jmeter-java-dsl to run the test plan embedded in Java test or code.
TIP
When the JMX uses some custom plugin or JMeter protocol support, you might need to add required dependencies to be able to run the test in an embedded engine. For example, when running a TN3270 JMX test plan using RTE plugin you will need to add the following repository and dependencies:
<repositories>
  <repository>
    <id>jitpack.io</id>
    <url>https://jitpack.io</url>
  </repository>
</repositories>

<dependencies>
  ...
  <dependency>
    <groupId>com.github.Blazemeter</groupId>
    <artifactId>RTEPlugin</artifactId>
    <version>3.1</version>
    <scope>test</scope>
  </dependency>
  <dependency>
    <groupId>com.github.Blazemeter</groupId>
    <artifactId>dm3270</artifactId>
    <version>0.12.3-lib</version>
    <scope>test</scope>
  </dependency>
</dependencies>