User guide
Here we share some tips and examples on how to use the DSL to tackle common use cases.
Provided examples use Nunit, but you can use other test libraries.
Explore the DSL in your preferred IDE to discover all available features, and consider reviewing existing tests for additional examples.
The .Net DSL currently does not support all use cases supported by the Java Dsl, and currently only focuses on a limited set of features that cover the most commonly used cases. If you identify any particular scenario (or JMeter feature) that you need and is not currently supported, or easy to use, please let us know by creating an issue and we will try to implement it as soon as possible. Usually porting JMeter features is quite fast, and porting existing Java DSL features is even faster.
TIP
If you like this project, please give it a star ⭐ in GitHub!. This helps the project be more visible, gain relevance and encourages us to invest more effort in new features.
For an intro to JMeter concepts and components, you can check JMeter official documentation.
Setup
To use the DSL just include it in your project:
dotnet add package Abstracta.JmeterDsl --version 0.5
TIP
Here is a sample project in case you want to start one from scratch.
WARNING
JMeter .Net DSL uses existing JMeter Java DSL which in turn uses JMeter. JMeter Java DSL and JMeter are Java based tools. So, Java 8+ is required for the proper execution of DSL test plans. One option is downloading a JVM from Adoptium if you don't have one already.
Simple HTTP test plan
To generate HTTP requests just use provided HttpSampler.
The following example uses 2 threads (concurrent users) that send 10 HTTP GET requests each to http://my.service.
Additionally, it logs collected statistics (response times, status codes, etc.) to a file (for later analysis if needed) and checks that the response time 99 percentile is less than 5 seconds.
using static Abstracta.JmeterDsl.JmeterDsl;

public class PerformanceTest
{
    [Test]
    public void LoadTest()
    {
        var stats = TestPlan(
            ThreadGroup(2, 10,
                HttpSampler("http://my.service")
            ),
            //this is just to log details of each request stats
            JtlWriter("jtls")
        ).Run();
        Assert.That(stats.Overall.SampleTimePercentile99, Is.LessThan(TimeSpan.FromSeconds(5)));
    }
}
TIP
When working with multiple samplers in a test plan, specify their names (eg: HttpSampler("home", "http://my.service")) to easily check their respective statistics.
TIP
JMeter .Net DSL uses Java for executing JMeter test plans. If you need to tune JVM parameters, for example for specifying maximum heap memory size, you can use EmbeddedJMeterEngine and the JvmArgs method like in the following example:
using Abstracta.JmeterDsl.Core.Engines;
...
var stats = TestPlan(
    ThreadGroup(2, 10,
        HttpSampler("http://my.service")
    )
).RunIn(new EmbeddedJmeterEngine()
    .JvmArgs("-Xmx4g")
);
TIP
Since JMeter uses log4j2, if you want to control the logging level or output, you can use something similar to this log4j2.xml, using "CopyToOutputDirectory" in the project item, so the file is available in dotnet build output directory as well (check [Abstracta.JmeterDsl.Test/Abstracta.JmeterDsl.Tests.csproj]).
TIP
Depending on the test framework you use, and the way you run your tests, you might be able to see JMeter logs and output in real-time, at the end of the test, or not see them at all. This is not something we can directly control in JMeter DSL, and heavily depends on the dotnet environment and testing framework implementation.
When using Nunit, to get real-time console output from JMeter you might want to run your tests with something like dotnet test -v n and add the following code to your tests:
private TextWriter? originalConsoleOut;

// Redirecting output to progress to get live stdout with nunit.
// https://github.com/nunit/nunit3-vs-adapter/issues/343
// https://github.com/nunit/nunit/issues/1139
[SetUp]
public void SetUp()
{
    originalConsoleOut = Console.Out;
    Console.SetOut(TestContext.Progress);
}

[TearDown]
public void TearDown()
{
    Console.SetOut(originalConsoleOut!);
}
TIP
Keep in mind that you can use .Net programming to modularize and create abstractions which allow you to build complex test plans that are still easy to read, use and maintain. Here is an example of some complex abstraction built using Java features (you can easily extrapolate to .Net) and the DSL.
Check HTTP performance testing for additional details while testing HTTP services.
Run test at scale
Running a load test from one machine is not always enough, since you are limited to the machine's hardware capabilities. Sometimes, is necessary to run the test using a cluster of machines to be able to generate enough load for the system under test. Currently, the .Net DSL only provides two ways to run tests at scale, but in the future, we plan to support more (as Java DSL does). If you are interested in some not yet covered feature, please ask for it by creating an issue in the repository.
Azure Load Testing
To use Azure Load Testing to execute your test plans at scale is as easy as including the following package to your project:
dotnet add package Abstracta.JmeterDsl.Azure --version 0.5
And using the provided engine like this:
using Abstracta.JmeterDsl.Azure;
using static Abstracta.JmeterDsl.JmeterDsl;

public class PerformanceTest
{
    [Test]
    public void LoadTest()
    {
        var stats = TestPlan(
            ThreadGroup(2, 10,
                HttpSampler("http://my.service")
            )
        ).RunIn(new AzureEngine(Environment.GetEnvironmentVariable("AZURE_CREDS")) // AZURE_CREDS=tenantId:clientId:secretId
            .TestName("dsl-test")
            /*
            This specifies the number of engine instances used to execute the test plan.
            In this case, means that it will run 2(threads in thread group)x2(engines)=4 concurrent users/threads in total.
            Each engine executes the test plan independently.
            */
            .Engines(2)
            .TestTimeout(TimeSpan.FromMinutes(20)));
        Assert.That(stats.Overall.SampleTimePercentile99, Is.LessThan(TimeSpan.FromSeconds(5)));
    }
}
This test is using
AZURE_CREDS, a custom environment variable containingtenantId:clientId:clientSecretwith proper values for each. Check at Azure Portal tenant properties the proper tenant ID for your subscription, and follow this guide to register an application with proper permissions and secrets generation for tests execution.
With Azure, you can not only run the test at scale but also get additional features like nice real-time reporting, historic data tracking, etc. Here is an example of how a test looks like in Azure Load Testing:
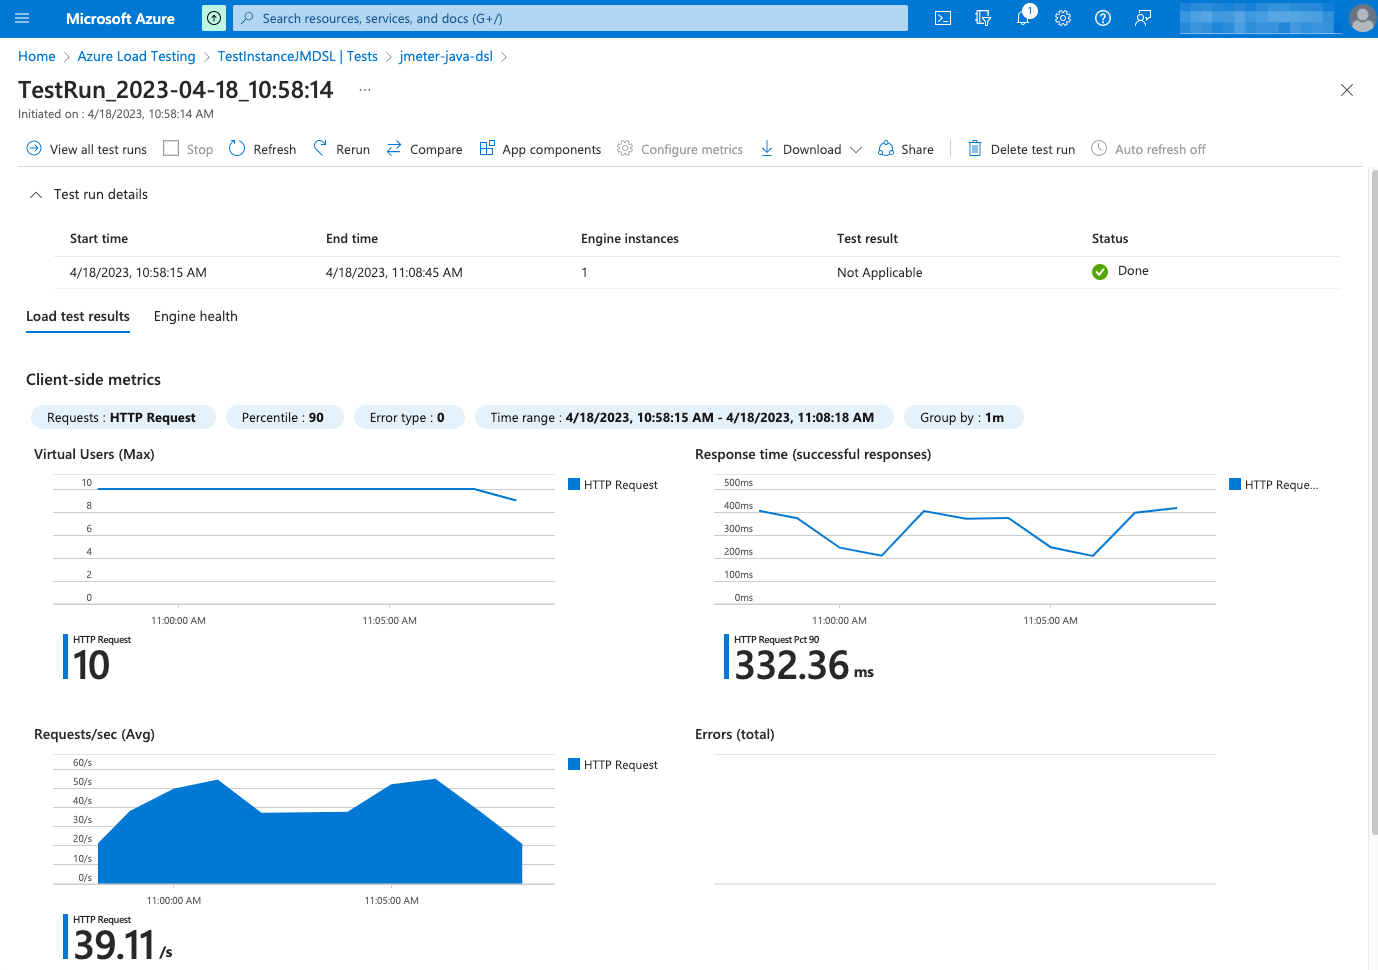
Check AzureEngine for details on usage and available settings when running tests in Azure Load Testing.
WARNING
By default, the engine is configured to time out if test execution takes more than 1 hour. This timeout exists to avoid any potential problem with Azure Load Testing execution not detected by the client, and avoid keeping the test indefinitely running until is interrupted by a user, which may incur unnecessary expenses in Azure and is especially annoying when running tests in an automated fashion, for example in CI/CD. It is strongly advised to set this timeout properly in each run, according to the expected test execution time plus some additional margin (to consider for additional delays in Azure Load Testing test setup and teardown) to avoid unexpected test plan execution failure (due to timeout) or unnecessary waits when there is some unexpected issue with Azure Load Testing execution.
TIP
If you want to get debug logs for HTTP calls to Azure API, you can include the following setting to an existing log4j2.xml configuration file:
<Logger name="us.abstracta.jmeter.javadsl.azure.AzureClient" level="DEBUG"/>
<Logger name="okhttp3" level="DEBUG"/>
BlazeMeter
By including the following package:
dotnet add package Abstracta.JmeterDsl.BlazeMeter --version 0.5
You can easily run a JMeter test plan at scale in BlazeMeter like this:
using Abstracta.JmeterDsl.BlazeMeter;
using static Abstracta.JmeterDsl.JmeterDsl;

public class PerformanceTest
{
    [Test]
    public void LoadTest()
    {
        var stats = TestPlan(
            // number of threads and iterations are in the end overwritten by BlazeMeter engine settings
            ThreadGroup(2, 10,
                HttpSampler("http://my.service")
            )
        ).RunIn(new BlazeMeterEngine(Environment.GetEnvironmentVariable("BZ_TOKEN"))
            .TestName("DSL test")
            .TotalUsers(500)
            .HoldFor(TimeSpan.FromMinutes(10))
            .ThreadsPerEngine(100)
            .TestTimeout(TimeSpan.FromMinutes(20))
            .TestName("dsl-test"));
        Assert.That(stats.Overall.SampleTimePercentile99, Is.LessThan(TimeSpan.FromSeconds(5)));
    }
}
This test is using
BZ_TOKEN, a custom environment variable with<KEY_ID>:<KEY_SECRET>format, to get the BlazeMeter API authentication credentials.
Note that is as simple as generating a BlazeMeter authentication token and adding .RunIn(new BlazeMeterEngine(...)) to any existing JMeter DSL test to get it running at scale in BlazeMeter.
BlazeMeter will not only allow you to run the test at scale but also provides additional features like nice real-time reporting, historic data tracking, etc. Here is an example of how a test would look in BlazeMeter:
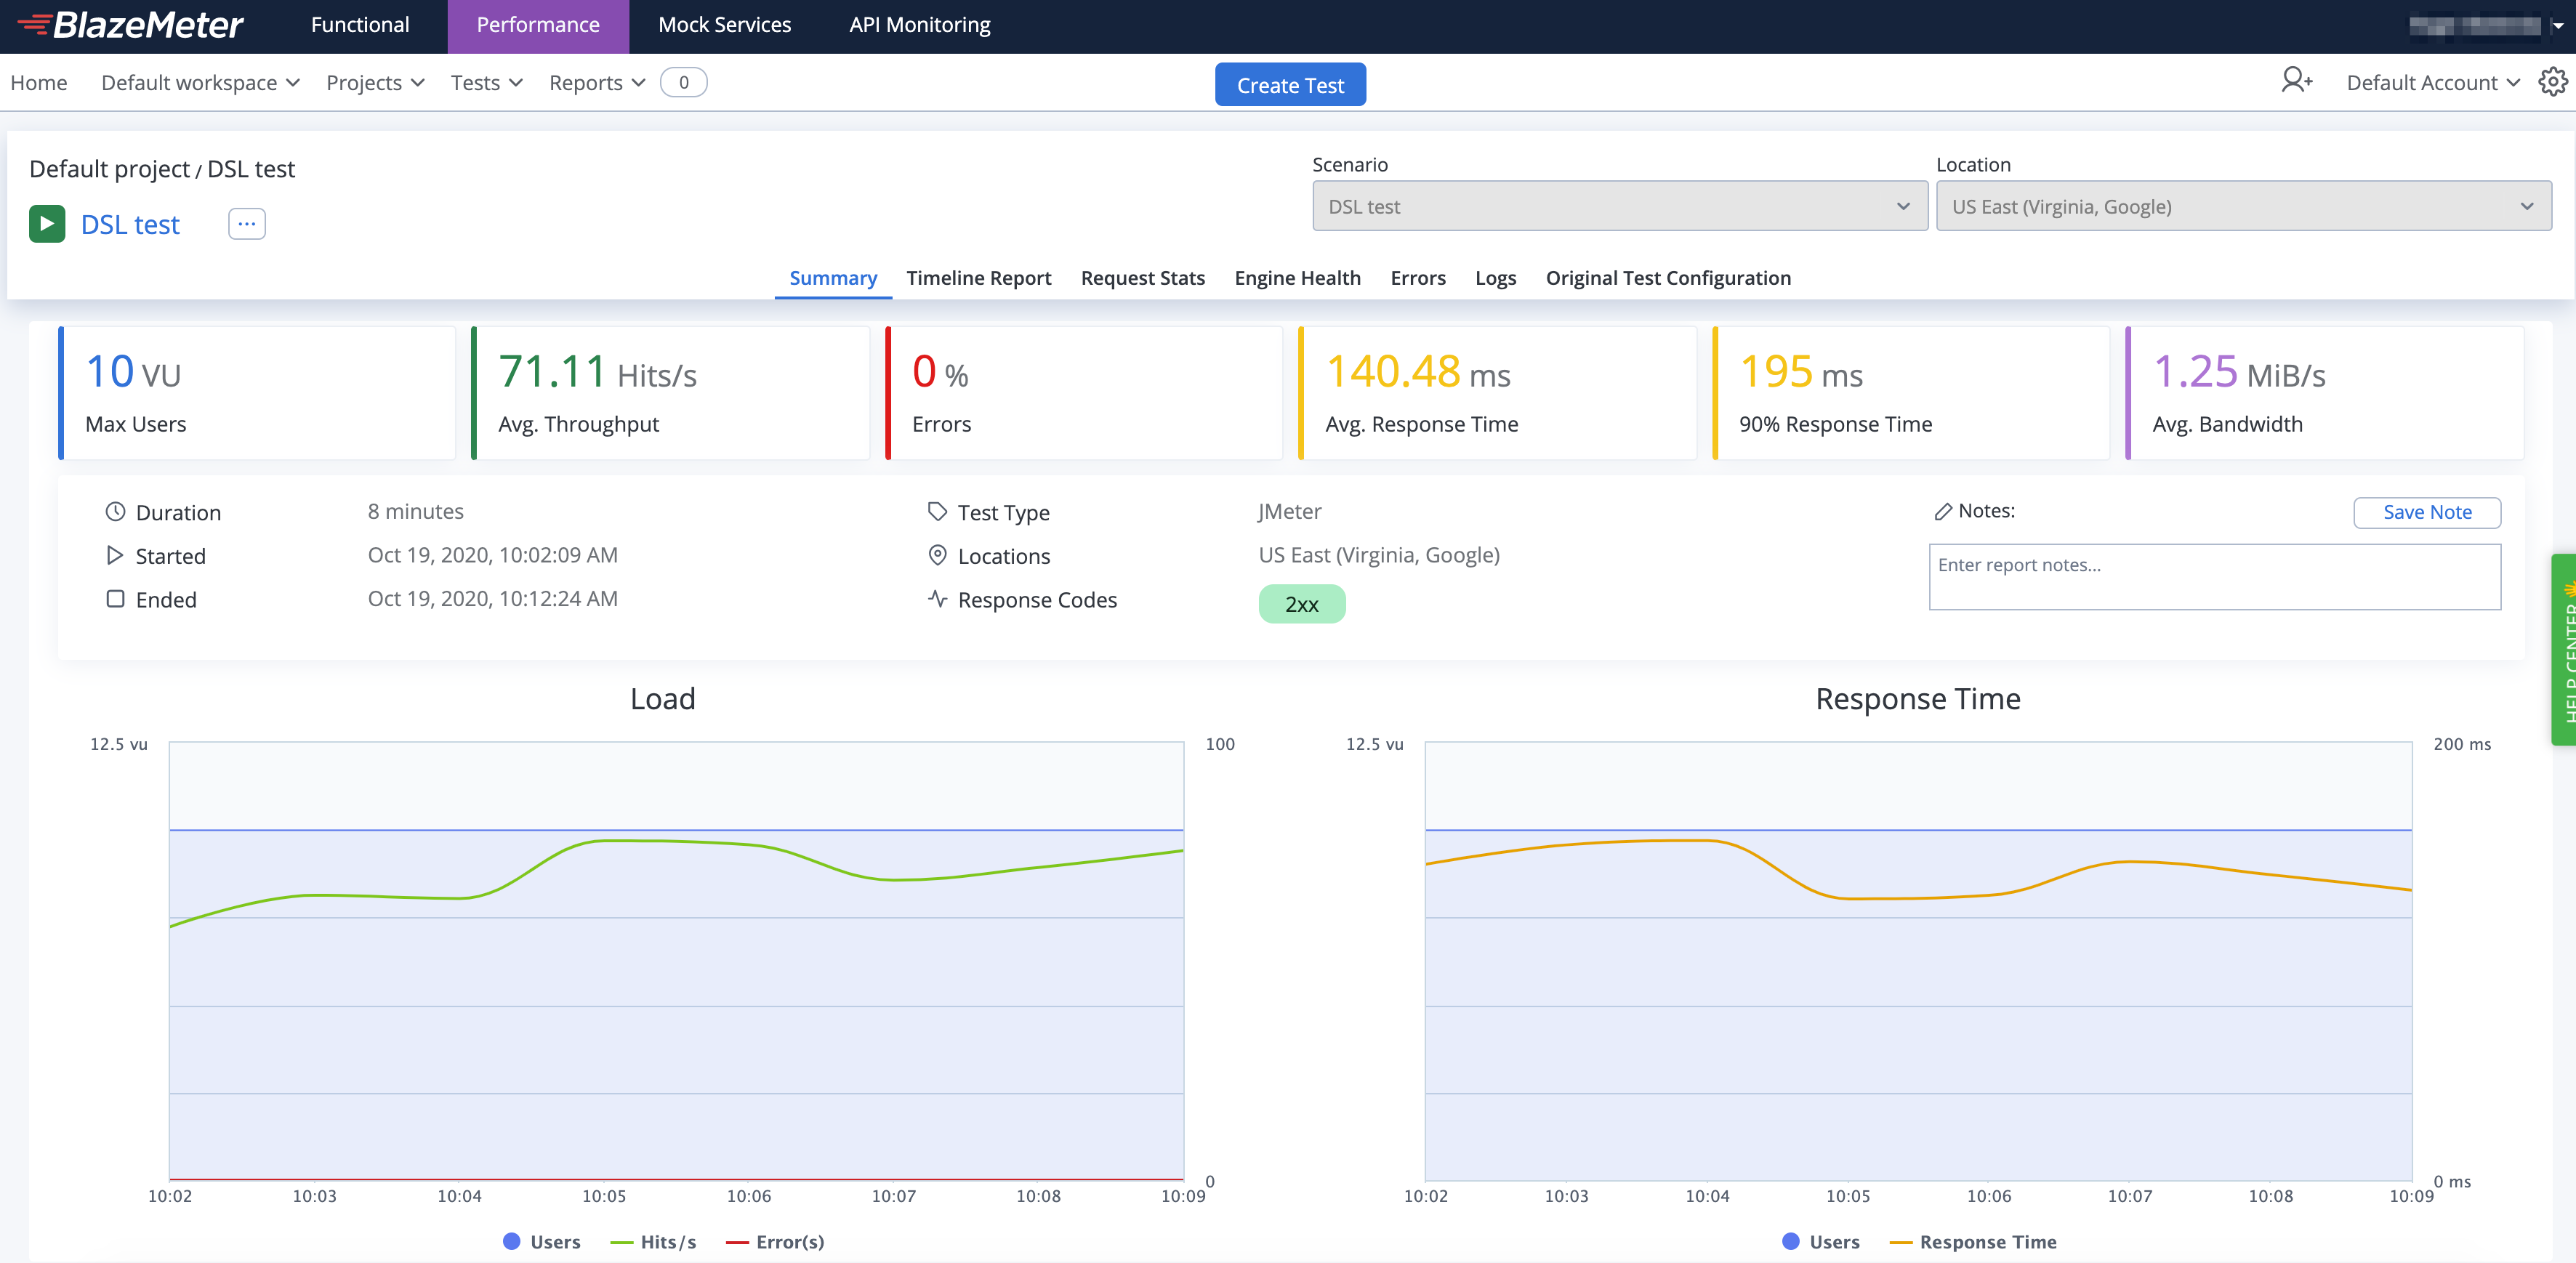
Check BlazeMeterEngine for details on usage and available settings when running tests in BlazeMeter.
WARNING
By default the engine is configured to timeout if test execution takes more than 1 hour. This timeout exists to avoid any potential problem with BlazeMeter execution not detected by the client, and avoid keeping the test indefinitely running until is interrupted by a user, which may incur in unnecessary expenses in BlazeMeter and is specially annoying when running tests in automated fashion, for example in CI/CD. It is strongly advised to set this timeout properly in each run, according to the expected test execution time plus some additional margin (to consider for additional delays in BlazeMeter test setup and teardown) to avoid unexpected test plan execution failure (due to timeout) or unnecessary waits when there is some unexpected issue with BlazeMeter execution.
WARNING
BlazeMeterEngine always returns 0 as sentBytes statistics since there is no efficient way to get it from BlazMeter.
TIP
In case you want to get debug logs for HTTP calls to BlazeMeter API, you can include the following setting to an existing log4j2.xml configuration file:
<Logger name="us.abstracta.jmeter.javadsl.blazemeter.BlazeMeterClient" level="DEBUG"/>
<Logger name="okhttp3" level="DEBUG"/>
Advanced threads configuration
JMeter DSL provides two simple ways of creating thread groups which are used in most scenarios:
- specifying threads and the number of iterations each thread should execute before ending the test plan
- specifying threads and duration for which each thread should execute before the test plan ends
This is how they look in code:
ThreadGroup(10, 20, ...) // 10 threads for 20 iterations each
ThreadGroup(10, TimeSpan.FromSeconds(20), ...) // 10 threads for 20 seconds each
But these options are not good when working with many threads or when trying to configure some complex test scenarios (like when doing incremental or peak tests).
Thread ramps and holds
When working with many threads, it is advisable to configure a ramp-up period, to avoid starting all threads at once affecting performance metrics and generation.
You can easily configure a ramp-up with the DSL like this:
ThreadGroup().RampTo(10, TimeSpan.FromSeconds(5)).HoldIterating(20) // ramp to 10 threads for 5 seconds (1 thread every half second) and iterating each thread 20 times
ThreadGroup().RampToAndHold(10, TimeSpan.FromSeconds(5), TimeSpan.FromSeconds(20)) //similar as above but after ramping up holding execution for 20 seconds
Additionally, you can use and combine these same methods to configure more complex scenarios (incremental, peak, and any other types of tests) like the following one:
ThreadGroup()
    .RampToAndHold(10, TimeSpan.FromSeconds(5), TimeSpan.FromSeconds(20))
    .RampToAndHold(100, TimeSpan.FromSeconds(10), TimeSpan.FromSeconds(30))
    .RampTo(200, TimeSpan.FromSeconds(10))
    .RampToAndHold(100, TimeSpan.FromSeconds(10), TimeSpan.FromSeconds(30))
    .RampTo(0, TimeSpan.FromSeconds(5))
    .Children(
      HttpSampler("http://my.service")
    )
Which would translate into the following threads' timeline:
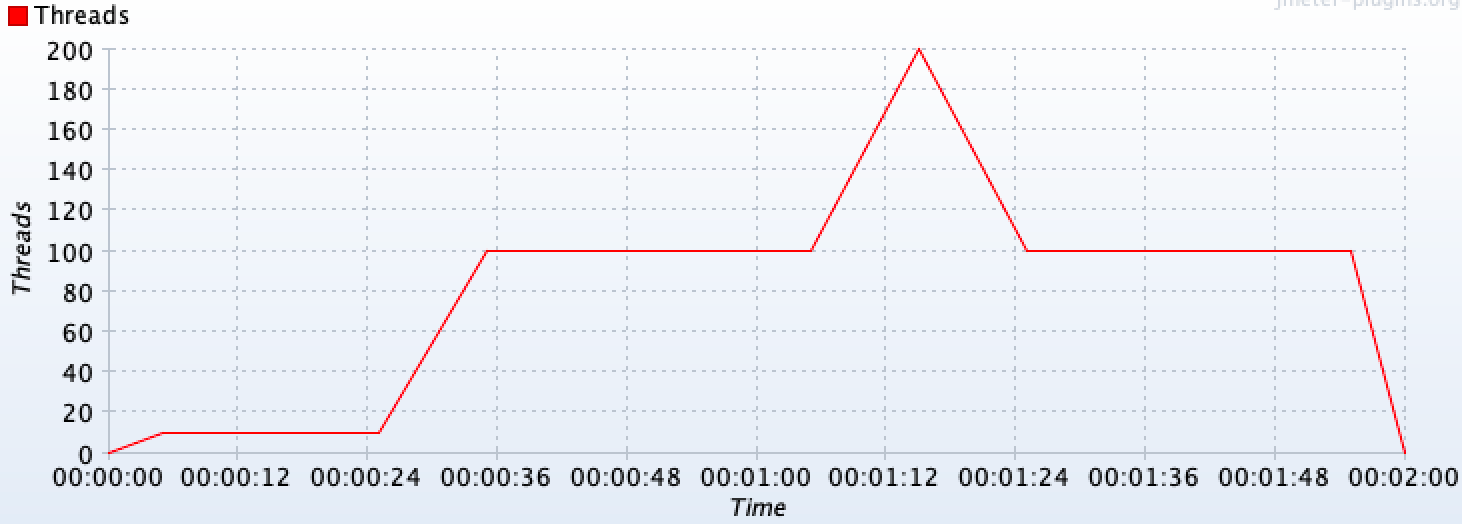
Check DslThreadGroup for more details.
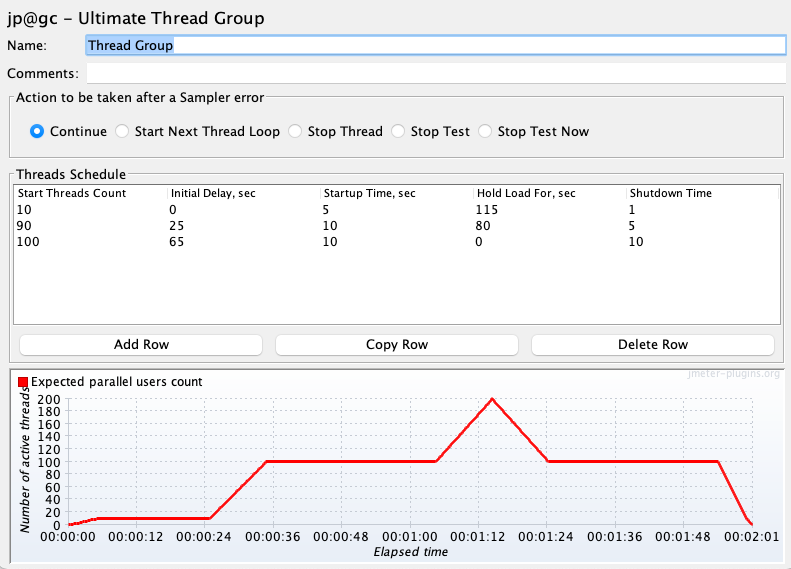
TIP
If you are a JMeter GUI user, you may even be interested in using provided TestElement.ShowInGui() method, which shows the JMeter test element GUI that could help you understand what will DSL execute in JMeter. You can use this method with any test element generated by the DSL (not just thread groups).
For example, for the above test plan you would get a window like the following one:
TIP
When using multiple thread groups in a test plan, consider setting a name (eg: ThreadGroup("main", 1, 1, ...)) on them to properly identify associated requests in statistics & jtl results.
Test plan debugging
A usual requirement while building a test plan is to be able to review requests and responses and debug the test plan for potential issues in the configuration or behavior of the service under test. With JMeter DSL you have several options for this purpose.
View results tree
One option is using provided ResultsTreeVisualizer() like in the following example:
using static Abstracta.JmeterDsl.JmeterDsl;

public class PerformanceTest
{
    [Test]
    public void LoadTest()
    {
        var stats = TestPlan(
            ThreadGroup(2, 10,
                HttpSampler("http://my.service")
            ),
            ResultsTreeVisualizer()
        ).Run();
    }
}
This will display the JMeter built-in View Results Tree element, which allows you to review request and response contents in addition to collected metrics (spent time, sent & received bytes, etc.) for each request sent to the server, in a window like this one:

TIP
To debug test plans use a few iterations and threads to reduce the execution time and ease tracing by having less information to analyze.
TIP
When adding ResultsTreeVisualizer() as a child of a thread group, it will only display sample results of that thread group. When added as a child of a sampler, it will only show sample results for that sampler. You can use this to only review certain sample results in your test plan.
TIP
Remove ResultsTreeVisualizer() from test plans when are no longer needed (when debugging is finished). Leaving them might interfere with unattended test plan execution (eg: in CI) due to test plan execution not finishing until all visualizers windows are closed.
WARNING
By default, View Results Tree only displays the last 500 sample results. If you need to display more elements, use provided ResultsLimit(int) method which allows changing this value. Take into consideration that the more results are shown, the more memory that will require. So use this setting with care.
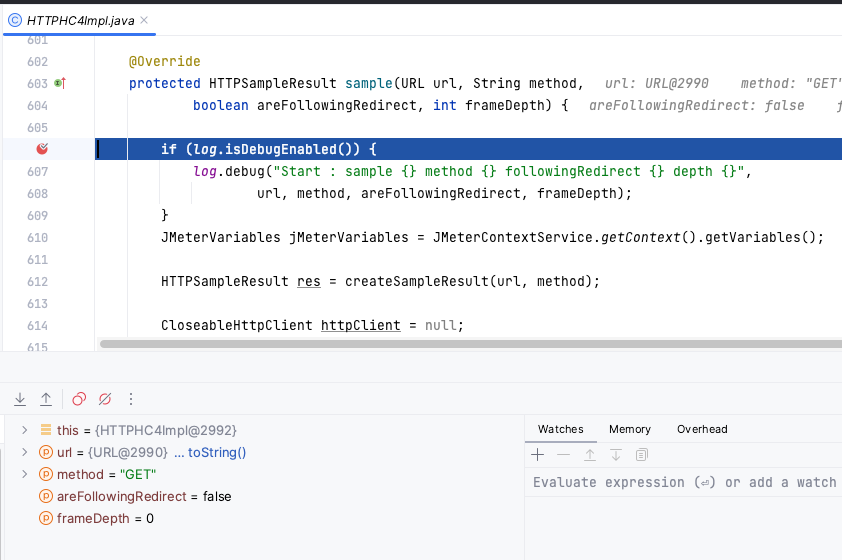
Debug JMeter code
You can even add breakpoints to JMeter or JMeter Java DSL code in your IDE and debug the code line by line providing the greatest possible detail.
Here is an example screenshot debugging HTTP Sampler:
For that, you need to:
- have a Java IDE with JMeter or JMeter Java DSL code open.
- set proper breakpoints in the code you are interested in debugging.
- can configure Remote JVM Debug like in the following screenshot:
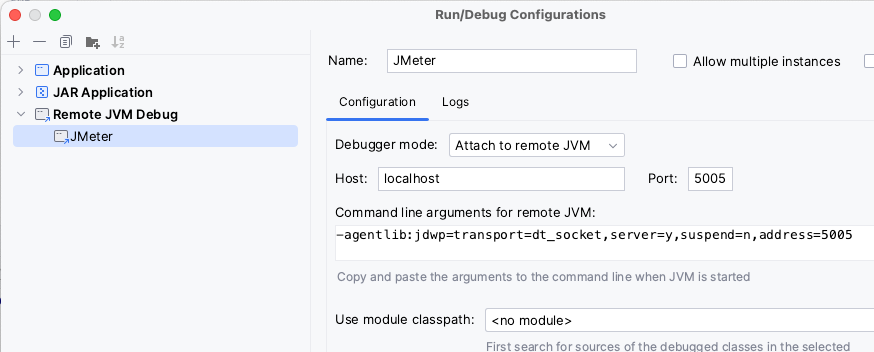
- set required JVM arguments in the JMeter .Net DSL test using
EmbeddedJmeterEnginelike in the following example:TestPlan( ThreadGroup(threads: 1, iterations: 1, HttpSampler("http://my.service") ) ).RunIn(new EmbeddedJmeterEngine() .JvmArgs("-agentlib:jdwp=transport=dt_socket,server=y,suspend=y,address=5005"));Note that we changed the
suspendflag toyto block test execution until Remote JVM Debug is run in IDE. - run the JMeter .Net DSL test. The test should get stuck until you start Remote JVM Debug in the Java IDE.
- start the Remote JVM Devug in the Java IDE.
- wait for a breakpoint to activate and debug as usual 🙂.
TIP
JMeter class in charge of executing threads logic is org.apache.jmeter.threads.JMeterThread. You can check the classes used by each DSL-provided test element by checking the Java DSL code.
Dummy sampler
In many cases, you want to be able to test part of the test plan but without directly interacting with the service under test, avoiding any potential traffic to the servers, testing some border cases which might be difficult to reproduce with the actual server, and avoid actual server interactions variability and potential unpredictability. In such scenarios, you might replace actual samplers with DummySampler (which uses Dummy Sampler plugin) to be able to test extractors, assertions, controllers conditions, and other parts of the test plan under certain conditions/results generated by the samplers.
Here is an example:
using static Abstracta.JmeterDsl.JmeterDsl;

public class PerformanceTest
{
    [Test]
    public void LoadTest()
    {
        TestPlan(
            ThreadGroup(2, 10,
                // HttpSampler("http://my.service")
                DummySampler("{\"status\" : \"OK\"}")
            )
        ).Run();
    }
}
TIP
The DSL configures dummy samplers by default, in contrast to what JMeter does, with response time simulation disabled. This allows to speed up the debugging process, not having to wait for proper response time simulation (sleeps/waits). If you want a more accurate emulation, you might turn it on through the ResponseTimeSimulation() method.
Check DslDummySampler for more information o additional configuration and options.
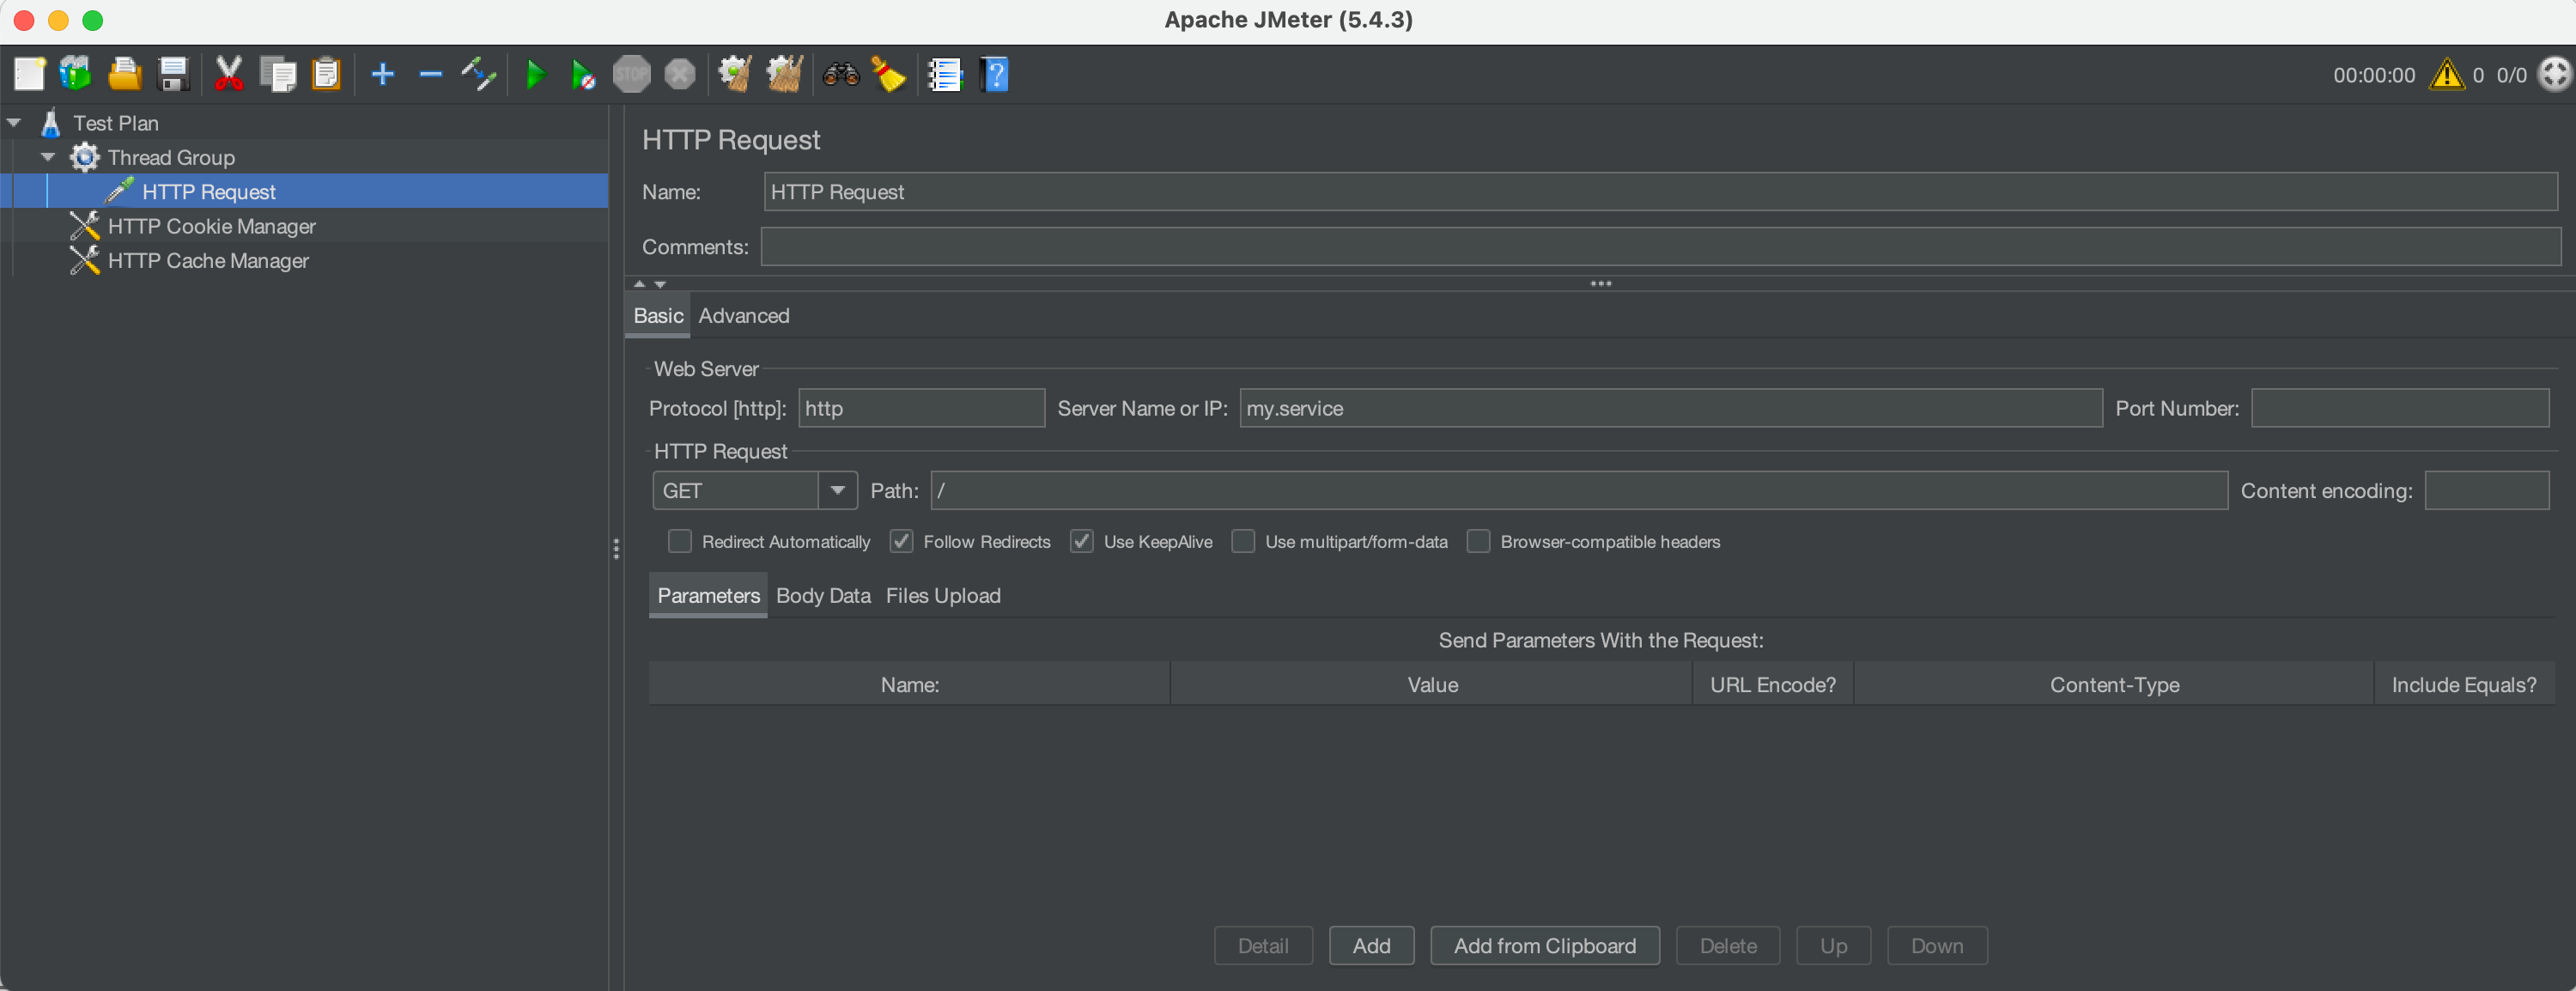
Test plan review un JMeter GUI
A usual requirement for new DSL users that are used to Jmeter GUI, is to be able to review Jmeter DSL generated test plan in the familiar JMeter GUI. For this, you can use the ShowInGui() method in a test plan to open JMeter GUI with the preloaded test plan.
This can be also used to debug the test plan, by adding elements (like view results tree, dummy samplers, etc.) in the GUI and running the test plan.
Here is a simple example using the method:
using static Abstracta.JmeterDsl.JmeterDsl;

public class PerformanceTest
{
    [Test]
    public void LoadTest()
    {
        var stats = TestPlan(
            ThreadGroup(2, 10,
                HttpSampler("http://my.service")
            )
        ).ShowInGui();
    }
}
Which ends up opening a window like this one:
Reporting
Once you have a test plan you would usually want to be able to analyze the collected information. This section contains a few ways to achieve this, but in the future, we plan to support more (as Java DSL does). If you are interested in some not yet covered feature, please ask for it by creating an issue in the repository.
Log requests and responses
The main mechanism provided by JMeter (and Abstracta.JmeterDsl) to get information about generated requests, responses, and associated metrics is through the generation of JTL files.
This can be easily achieved by using provided JtlWriter like in this example:
using static Abstracta.JmeterDsl.JmeterDsl;

public class PerformanceTest
{
    [Test]
    public void LoadTest()
    {
        var stats = TestPlan(
            ThreadGroup(2, 10,
                HttpSampler("http://my.service")
            ),
            JtlWriter("jtls")
        ).Run();
    }
}
TIP
By default, JtlWriter will write the most used information to evaluate the performance of the tested service. If you want to trace all the information of each request you may use JtlWriter with the WithAllFields() option. Doing this will provide all the information at the cost of additional computation and resource usage (fewer resources for actual load testing). You can tune which fields to include or not with JtlWriter and only log what you need, check JtlWriter for more details.
TIP
JtlWriter will automatically generate .jtl files applying this format: <yyyy-MM-dd HH-mm-ss> <UUID>.jtl.
If you need a specific file name, for example for later postprocessing logic (eg: using CI build ID), you can specify it by using JtlWriter(directory, fileName).
When specifying the file name, make sure to use unique names, otherwise, the JTL contents may be appended to previous existing jtl files.
An additional option, specially targeted towards logging sample responses, is ResponseFileSaver which automatically generates a file for each received response. Here is an example:
using static Abstracta.JmeterDsl.JmeterDsl;

public class PerformanceTest
{
    [Test]
    public void LoadTest()
    {
        TestPlan(
            ThreadGroup(2, 10,
                HttpSampler("http://my.service")
            ),
            ResponseFileSaver(DateTime.Now.ToString("dd-MM-yyyy HH:mm:ss").Replace(":", "-") + "-response")
        ).Run();
    }
}
Check ResponseFileSaver for more details.
Response processing
Use part of a response in a subsequent request (aka correlation)
It is a usual requirement while creating a test plan for an application to be able to use part of a response (e.g.: a generated ID, token, etc.) in a subsequent request. This can be easily achieved using JMeter extractors and variables.
Regular expressions extraction
Here is an example with JMeter DSL using regular expressions:
using System.Net.Http.Headers;
using System.Net.Mime;

using static Abstracta.JmeterDsl.JmeterDsl;

public class PerformanceTest
{
    [Test]
    public void LoadTest()
    {
        var stats = TestPlan(
            ThreadGroup(2, 10,
                HttpSampler("http://my.service/accounts")
                    .Post("{\"name\": \"John Doe\"}", new MediaTypeHeaderValue(MediaTypeNames.Application.Json))
                    .Children(
                        RegexExtractor("ACCOUNT_ID", "\"id\":\"([^\"]+)\"")
                    ),
                HttpSampler("http://my.service/accounts/${ACCOUNT_ID}")
            )
        ).Run();
        Assert.That(stats.Overall.SampleTimePercentile99, Is.LessThan(TimeSpan.FromSeconds(5)));
    }
}
Check DslRegexExtractor for more details and additional options.
Requests generation
Loops
Iterating a fixed number of times
In simple scenarios where you just want to execute a fixed number of times, within a thread group iteration, a given part of the test plan, you can just use ForLoopController (which uses JMeter Loop Controller component) as in the following example:
using static Abstracta.JmeterDsl.JmeterDsl;

public class PerformanceTest
{
    [Test]
    public void LoadTest()
    {
        var stats = TestPlan(
            ThreadGroup(2, 10,
                ForLoopController(5,
                    HttpSampler("http://my.service/accounts")
                )
            )
        ).Run();
        Assert.That(stats.Overall.SampleTimePercentile99, Is.LessThan(TimeSpan.FromSeconds(5)));
    }
}
This will result in 10 * 5 = 50 requests to the given URL for each thread in the thread group.
TIP
JMeter automatically generates a variable __jm__<loopName>__idx with the current index of for loop iteration (starting with 0) which you can use in children elements. The default name for the for loop controller, when not specified, is for.
Check ForLoopController for more details.
CSV as input data for requests
Sometimes is necessary to run the same flow but using different pre-defined data on each request. For example, a common use case is to use a different user (from a given set) in each request.
This can be easily achieved using the provided CsvDataSet element. For example, having a file like this one:
USER,PASS
user1,pass1
user2,pass2
You can implement a test plan that tests recurrent login with the two users with something like this:
using System;
using System.Net.Http;
using System.Net.Http.Headers;
using System.Net.Mime;
using static Abstracta.JmeterDsl.JmeterDsl;

public class PerformanceTest
{
    [Test]
    public void LoadTest()
    {
        var stats = TestPlan(
            CsvDataSet("users.csv"),
            ThreadGroup(5, 10,
                HttpSampler("http://my.service/login")
                    .Post("{\"${USER}\": \"${PASS}\"", new MediaTypeHeaderValue(MediaTypeNames.Application.Json)),
                HttpSampler("http://my.service/logout")
                    .Method(HttpMethod.Post.Method)
            )
        ).Run();
        Assert.That(stats.Overall.SampleTimePercentile99, Is.LessThan(TimeSpan.FromSeconds(5)));
    }
}
TIP
By default, the CSV file will be opened once and shared by all threads. This means that when one thread reads a CSV line in one iteration, then the following thread reading a line will continue with the following line.
If you want to change this (to share the file per thread group or use one file per thread), then you can use the provided SharedIn method like in the following example:
using static Abstracta.JmeterDsl.Core.Configs.DslCsvDataSet;
...
    var stats = TestPlan(
        CsvDataSet("users.csv")
            .SharedIn(Sharing.Thread),
        ThreadGroup(5, 10,
            HttpSampler("http://my.service/login")
                .Post("{\"${USER}\": \"${PASS}\"", new MediaTypeHeaderValue(MediaTypeNames.Application.Json)),
            HttpSampler("http://my.service/logout")
                .Method(HttpMethod.Post.Method)
        )
    ).Run();
    Assert.That(stats.Overall.SampleTimePercentile99, Is.LessThan(TimeSpan.FromSeconds(5)));
WARNING
You can use the RandomOrder() method to get CSV lines in random order (using Random CSV Data Set plugin), but this is less performant as getting them sequentially, so use it sparingly.
Check DslCsvDataSet for additional details and options (like changing delimiter, handling files without headers line, stopping on the end of file, etc.).
Provide request parameters programmatically per request
So far we have seen a how to generate requests with information extracted from CSV, but this is not enough for some scenarios. When you need more flexibility and power you can use jsr223preProcessor to specify your own logic to build each request.
Here is an example:
using System;
using System.Net.Http.Headers;
using System.Net.Mime;
using static Abstracta.JmeterDsl.JmeterDsl;

public class PerformanceTest
{
    [Test]
    public void LoadTest()
    {
        var stats = TestPlan(
            ThreadGroup(5, 10,
                HttpSampler("http://my.service")
                    .Post("${REQUEST_BODY}", new MediaTypeHeaderValue(MediaTypeNames.Text.Plain))
                    .Children(Jsr223PreProcessor("vars.put('REQUEST_BODY', '{\"time\": \"' + Instant.now() + '\"}')"))
            )
        ).Run();
        Assert.That(stats.Overall.SampleTimePercentile99, Is.LessThan(TimeSpan.FromSeconds(5)));
    }
}
TIP
For the time being only JSR223 scripts can be used. By default Groovy is used, but you can change to others by using the provided Language() method.
We plan in the future to look for alternatives as to be able to use .Net code as pre processor. If you are interested in this you can let us know in this issue posting your use case.
Check DslJsr223PreProcessor for more details and additional options.
Protocols
HTTP
Throughout this guide, several examples have been shown for simple cases of HTTP requests (mainly how to do gets and posts), but the DSL provides additional features that you might need to be aware of.
Here we show some of them, but check JmeterDsl and DslHttpSampler to explore all available features.
Methods & body
As previously seen, you can do simple gets and posts like in the following snippet:
HttpSampler("http://my.service") // A simple get
HttpSampler("http://my.service")
    .Post("{\"field\":\"val\"}", new MediaTypeHeaderValue(MediaTypeNames.Application.Json)) // simple post
But you can also use additional methods to specify any HTTP method and body:
HttpSampler("http://my.service")
  .Method(HttpMethod.Put.Method)
  .ContentType(new MediaTypeHeaderValue(MediaTypeNames.Application.Json))
  .Body("{\"field\":\"val\"}")
Parameters
In many cases, you will need to specify some URL query string parameters or URL encoded form bodies. For these cases, you can use Param method as in the following example:
using static Abstracta.JmeterDsl.JmeterDsl;
using System.Net.Http;

public class PerformanceTest
{
    [Test]
    public void LoadTest()
    {
        var baseUrl = "https://myservice.com/products";
        TestPlan(
            ThreadGroup(1, 1,
                // GET https://myservice.com/products?name=iron+chair
                HttpSampler("GetIronChair", baseUrl)
                    .Param("name", "iron chair"),
                /*
                * POST https://myservice.com/products
                * Content-Type: application/x-www-form-urlencoded
                *
                * name=wooden+chair
                */
                HttpSampler("CreateWoodenChair", baseUrl)
                    .Method(HttpMethod.Post.Method) // POST
                    .Param("name", "wooden chair")
            )
        ).Run();
    }
}
TIP
JMeter automatically URL encodes parameters, so you don't need to worry about special characters in parameter names or values.
If you want to use some custom encoding or have an already encoded value that you want to use, then you can use RawParam method instead which does not apply any encoding to the parameter name or value, and send it as is.
Headers
You might have already noticed in some of the examples that we have shown, some ways to set some headers. For instance, in the following snippet, Content-Type header is being set in two different ways:
HttpSampler("http://my.service")
  .Post("{\"field\":\"val\"}", new MediaTypeHeaderValue(MediaTypeNames.Application.Json))
HttpSampler("http://my.service")
  .ContentType(new MediaTypeHeaderValue(MediaTypeNames.Application.Json))
These are handy methods to specify the Content-Type header, but you can also set any header on a particular request using provided Header method, like this:
HttpSampler("http://my.service")
  .Header("X-First-Header", "val1")
  .Header("X-Second-Header", "val2")
Additionally, you can specify headers to be used by all samplers in a test plan, thread group, transaction controllers, etc. For this, you can use HttpHeaders like this:
TestPlan(
    ThreadGroup(2, 10,
        HttpHeaders()
          .Header("X-Header", "val1"),
        HttpSampler("http://my.service"),
        HttpSampler("http://my.service/users")
    )
).Run();
Multipart requests
When you need to upload files to an HTTP server or need to send a complex request body, you will in many cases require sending multipart requests. To send a multipart request just use BodyPart and BodyFilePart methods like in the following example:
using static Abstracta.JmeterDsl.JmeterDsl;
using System.Net.Http;
using System.Net.Http.Headers;
using System.Net.Mime;

public class PerformanceTest
{
    [Test]
    public void LoadTest()
    {
        TestPlan(
            ThreadGroup(1, 1,
                HttpSampler("https://myservice.com/report"),
                    .Method(HttpMethod.Post.Method)
                    .BodyPart("myText", "Hello World", new MediaTypeHeaderValue(MediaTypeNames.Text.Plain))
                    .BodyFilePart("myFile", "myReport.xml", new MediaTypeHeaderValue(MediaTypeNames.Text.Xml))
            )
        ).Run();
    }
}
Cookies & caching
JMeter DSL automatically adds a cookie manager and cache manager for automatic HTTP cookie and caching handling, emulating a browser behavior. If you need to disable them you can use something like this:
TestPlan(
    HttpCookies().Disable(),
    HttpCache().Disable(),
    ThreadGroup(2, 10,
        HttpSampler("http://my.service")
    )
)